 How to resolve AdBlock issue?
News
- Details
- Written by: Lake County News reports
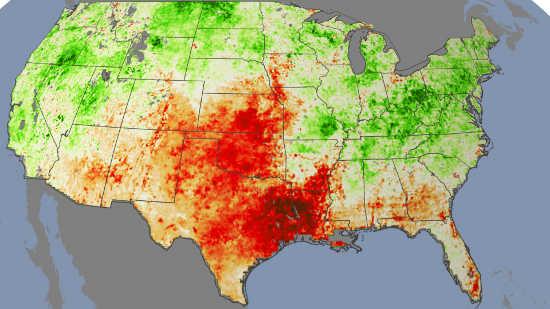
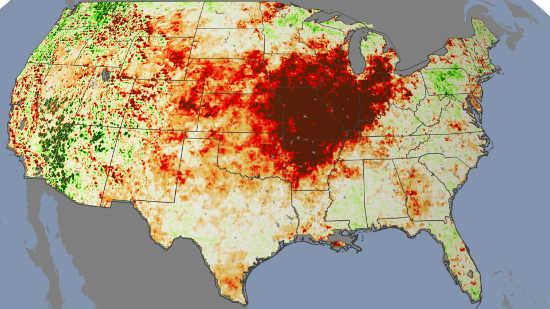
A new animation of plant stress shows how drought evolved across the United States from January 2010 through September 2012. Credit: NASA/Goddard Scientific Visualization Studio/USDA-ARS.
In July 2012, farmers in the U.S. Midwest and Plains regions watched crops wilt and die after a stretch of unusually low precipitation and high temperatures.
Before a lack of rain and record-breaking heat signaled a problem, however, scientists observed another indication of drought in data from NASA and NOAA satellites: plant stress.
Healthy vegetation requires a certain amount of water from the soil every day to stay alive, and when soil moisture falls below adequate levels, plants become stressed. Scientists with the U.S. Department of Agriculture’s Agricultural Research Service (USDA-ARS) have developed a way to use satellite data to map that plant stress.
The maps could soon aid in drought forecasts, and prove useful for applications such as crop yield estimates or decisions about crop loss compensation.
“Crop drought monitoring is of high practical value, and any advance notice of drought conditions helps the farmer make practical decisions sooner,” said Steve Running, an ecologist at University of Montana in Missoula.
A new animation of plant stress, which can be seen above, shows how drought evolved across the United States from January 2010 through September 2012.
In spring 2010, satellites measured cool leaf temperatures, indicating healthy plants and wetter-than-average conditions (green), over many areas across the country.
By summer 2011, satellites saw the warming of stressed vegetation, indicating significantly lower-than-usual water availability (red) in many areas, most notably in Texas. Crops were either dead or would soon be dead.
Drought in 2012 was the most severe and extensive in at least 25 years, according to the USDA’s Economic Research Service.
By August 60 percent of farms were in areas experiencing drought, and by mid-September USDA had designated more than 2,000 counties as disaster areas.
According to Martha Anderson with USDA-ARS in Beltsville, Md. – who is working with a team to develop the plant stress indicator for drought and presented the research Dec. 5, at the American Geophysical Union meeting in San Francisco – “2012 was record-breaking, this was just a huge event.”
The 2012 event is what experts call a flash drought, meaning that it evolved quickly and unexpectedly. Low soil moisture was further depleted by the heat wave that started in May, and drought abruptly followed.
By about May 5 the core regions of drought began to appear on the plant stress map – earlier than the signs of drought appeared in other indicators, such as rainfall measurements.
“We think there’s some early-warning potential with these plant stress maps, alerting us as the crops start to run out of water,” Anderson said.
Signals of plant stress may often appear first in satellite-derived maps of vegetation temperature before the crops have actually started to wilt and die.
“The earlier we can learn things are turning south, presumably the more time we have to prepare for whatever actions might be taken,” Anderson said.
For example, farmers may decide they need to buy supplemental feed from outside the drought-affected area to support their livestock, or they may need to adjust contract or insurance decisions.
The U.S. Drought Monitor already uses a combination of indices, such as rainfall, to describe drought conditions each week. The monitor currently does not include plant stress, but the potential is being explored.
“Plant stress is one representation of drought impacts, and the drought monitoring community agrees that you can’t do this with just one tool – you need a lot of different tools,” Anderson said.
Plant stress information has the potential to improve the skill of existing forecasts that predict drought out to weeks or months.
Also, because the plant stress information is derived from satellites, it can describe drought conditions in areas where rain gauge and radar networks are sparse – and it can do so at the scale of individual fields.
To produce the maps of plant stress, scientists start with the Moderate Resolution Imaging Spectroradiometer (MODIS) on NASA’s Terra and Aqua satellites. Images are processed to distinguish between land surfaces covered by soil and surfaces covered with vegetation.
Narrowing their focus to vegetated areas, scientists set out to measure moisture availability. Plants cool themselves by sweating water extracted from the soil by their roots.
When access to water is limited, plants lessen their consumption and reduce evapotranspiration from leaf surfaces. As a result, leaves heat up and produce an elevated leaf or canopy temperature, which can be detected by thermal sensors on NOAA’s geostationary weather satellites. Hotter plants imply limited water in the soil.
“This is not a drought forecast. It’s a map of what’s going on right now,” Anderson said. “Is there more or less water than usual?”
What is “usual” or normal, however, can depend on the season or even the year. Scientists currently define normal by calculating and mapping plant stress averaged over periods of 1-3 months, from the start of MODIS data collection in 2000 to present.
The mean of these historic maps is considered normal. Compare a current map with the longer-term “normal” map, and scientists get a picture of the magnitude by which current conditions deviate from normal.
“What was normal back in 1920 is not what’s normal now, so the more years we have under the belt the better we can define normal,” Anderson said. “But this year is so far out of line with respect to previous years, it is unusual regardless of the period of record used as the baseline.”
- Details
- Written by: Lake County News reports
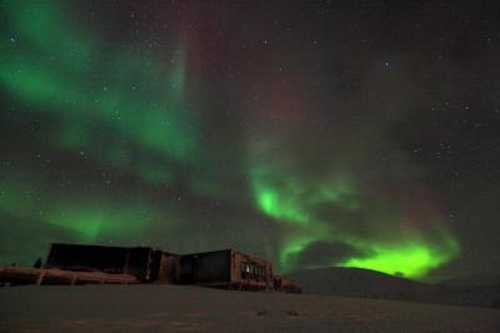
Hoping to expand our understanding of auroras and other fleeting atmospheric events, a team of space-weather researchers designed and built NORUSCA II, a new camera with unprecedented capabilities that can simultaneously image multiple spectral bands, in essence different wavelengths or colors, of light.
The camera was tested at the Kjell Henriksen Observatory (KHO) in Svalbard, Norway, where it produced the first-ever hyperspectral images of auroras – commonly referred to as “the Northern (or Southern) Lights” – and may already have revealed a previously unknown atmospheric phenomenon.
Details on the camera and the results from its first images were published in the Optical Society’s (OSA) open-access journal Optics Express.
Auroras, nature’s celestial fireworks, are created when charged particles from the Sun penetrate Earth’s magnetic field.
These shimmering displays in the night sky reveal important information about the Earth-Sun system and the way our planet responds to powerful solar storms.
Current-generation cameras, however, are simply light buckets – meaning they collect all the light together into one image – and lack the ability to separately capture and analyze multiple slivers of the visible spectrum.
That means if researchers want to study auroras by looking at specific bands or a small portion of the spectrum they would have to use a series of filters to block out the unwanted wavelengths.
The new NORUSCA II hyperspectral camera achieves the same result without any moving parts, using its advanced optics to switch among all of its 41 separate optical bands in a matter of microseconds, orders of magnitude faster than an ordinary camera.
This opens up new possibilities for discovery by combining specific bands of the same ethereal phenomenon into one image, revealing previously hidden details.
“A standard filter wheel camera that typically uses six interference filters will not be able to spin the wheel fast enough compared to the NORUSCA II camera,” said Fred Sigernes of the University Centre in Svalbard (UNIS), Norway. “This makes the new hyperspectral capability particularly useful for spectroscopy, because it can detect specific atmospheric constituents by their unique fingerprint, or wavelengths, in the light they emit.”
These spectral signatures can then reveal subtle changes in atmospheric behavior, such as the ionization of gases during auroras. This form of multispectral imaging also will enable scientists to better classify auroras from background sky emissions and study the way they cluster in the atmosphere.
A new phenomenon
On Jan. 24, 2012, during the inaugural research campaign of NORUSCA II, a major solar flare jettisoned a burst of high-energy particles known as a Coronal Mass Ejection (CME). The CME eventually slammed into Earth’s magnetic field, producing magnificent auroras and a chance to fully test the new camera.
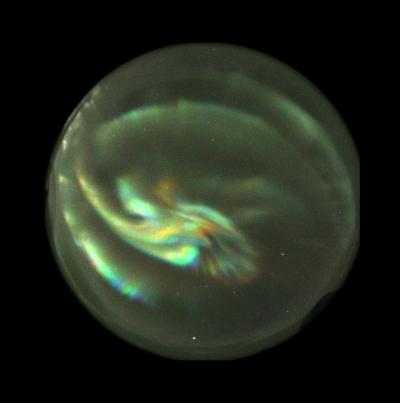
The researchers were able to image the aurora in unprecedented clarity through a layer of low altitude clouds, which would have thwarted earlier-generation instruments (see Image 1).
The camera also revealed something unexpected – a very faint wave pattern of unknown origin in the lower atmosphere.
The wave pattern resembles “airglow” – the natural emission of light by Earth’s atmosphere. Airglow can be produced by a variety of known sources, including cosmic rays striking the upper atmosphere and chemical reactions.
Its concurrent appearance with the aurora suggests that it may also be caused by a previously unrecognized source.
“After the January CME, we think we saw an auroral-generated wave interaction with airglow,” said Sigernes. This would be an entirely new phenomenon and if confirmed, would be the first time airglow has been associated with auroras.
“Our new all-sky camera opens up new frontiers of discovery and will help in the detection of auroras and the understanding of how our Sun impacts the atmosphere here on Earth. Additional development and commissioning will also hopefully verify our intriguing first results,” concluded Sigernes.

- Details
- Written by: Lake County News reports

CLEARLAKE OAKS, Calif. – Lake County offers a rich tapestry of wildlife that’s display all the year round.
On Thursday evening, Lake County resident James Hershey photographed the Wilson Valley elk herd paying a visit to Cache Creek Vineyards near Clearlake Oaks.
The Bureau of Land Management reports that the Wilson Valley elk are part of one of the few free-roaming tule elk herds in California.
Follow Lake County News on Twitter, @LakeCoNews.
- Details
- Written by: Lake County News reports
The state's public health director and state health officer has released a new report on tobacco use and promotion in the state.
California Department of Public Health (CDPH) director and state health officer Dr. Ron Chapman released the state’s first “State Health Officer’s Report on Tobacco Use and Promotion” providing new data related to cigarette consumption declines, and the millions of dollars and lives saved.
The report also includes new data on illegal sales to minors, the disproportionate number of tobacco retailers and advertising in minority and low-income neighborhoods, the effect of tobacco advertising in retail stores, and troubling tobacco-use trends.
“The illegal sale of tobacco to minors is a serious issue and we are committed to working with retailers and inform the public in order to stop these practices,” said Chapman. “The tobacco industry’s advertising tactics towards a younger audience is disturbing and shameful. It is startling that the tobacco industry spends nearly $1 million every hour to market their products nationwide.”
Although not necessarily a trend, the increase in illegal sales to minors is a fact that CDPH takes seriously.
The department is concerned about any increase of youth access to cigarettes and aims to prevent any uptick in youth smoking. CDPH continues to find innovative ways to work with retailers and to inform the public to stop these practices.
In addition to the latest data on illegal sales to minors, the state report draws attention to the disproportionate number of tobacco retailers, advertising tactics, the effect of tobacco advertising in retail stores, and examples of emerging tobacco use.
Specific information about Lake County was not available in the report. CDPH spokesman Corey Egel said the county's prevalence estimates are included in regional figures, as the sample size for Lake County is too small to estimate the prevalence by detailed age grouping (i.e. young adults age 18-24).
Highlights of the report include:
- Since the inception of the Tobacco Control Program, the annual number of cigarette packs sold in California dropped by more than 1.5 billion per year, from 2.5 billion packs in 1998 to 972,000 packs in 2011;
- Illegal tobacco sales to minors rose to 8.7 percent from 5.6 percent in 2011, which was the state’s lowest rate since the survey began in 1995;
- Prevalence of smoking was higher at schools in neighborhoods with five or more stores that sell tobacco than at schools in neighborhoods without any stores that sell tobacco;
- In 2011, young adults 18-24 had the highest smoking prevalence among any age group in California;
- The popularity, promotion and availability of smokeless tobacco have greatly increased – examples include snus (a smokeless, spitless, moist-snuff product), cigarillos (small flavored cigars that are often sold individually), as well as dissolvable and flavored “orbs” and “sticks” that are currently being test-marketed in other states;
- In less than a decade, sales of smokeless products have nearly tripled, from $77 million in 2001 to $211 million in 2011; and
- Nearly one-third (32.3 percent) of California stores that sell tobacco had at least one cigarette advertisement less than three feet above the floor, where it is easily seen by children.
“In 2012, smoking and the use of other tobacco products continues to be a major public health concern in California, with approximately 3.6 million smokers in the state,” added Chapman. “More than 34,000 deaths from tobacco-related illnesses occur every year, and the cost of adult health care related to smoking in California is projected to be $6.5 billion this year, about $400 per taxpayer. The most cost-effective way to decrease health care costs is to encourage and support tobacco cessation. I strongly urge all Californians who still smoke to quit.”
Chapman also unveiled new ethnic-market advertisements that will continue to educate Californians on the harmful effects of tobacco use.
In addition to the ads, a new Spanish Web site, www.CAsinTabaco.com , was launched to complement the campaign and to provide the Spanish-speaking community the tools they need to quit. Ads will start airing in early January and can be viewed at www.TobaccoFreeCA.com .
The California Tobacco Control Program was established by the Tobacco Tax and Health Protection Act of 1988.
The act, approved by California voters, instituted a 25-cent tax on each pack of cigarettes and earmarked five cents of that tax to fund California’s tobacco control efforts. These efforts include supporting local health departments and community organizations, an aggressive media campaign, and tobacco-related evaluation and surveillance.
California’s comprehensive approach has changed social norms around tobacco-use and secondhand smoke, resulting in dramatic results.
It is estimated California’s tobacco control efforts have saved more than one million lives and have resulted in $86 billion worth of savings in health care costs. Learn more at www.TobaccoFreeCA.com .
Follow Lake County News on Twitter, @LakeCoNews.