How to resolve AdBlock issue?
News
- Details
- Written by: Elizabeth Larson
Dogs available for adoption this week include mixes of border collie, pit bull and Rottweiler.
Dogs that are adopted from Lake County Animal Care and Control are either neutered or spayed, microchipped and, if old enough, given a rabies shot and county license before being released to their new owner. License fees do not apply to residents of the cities of Lakeport or Clearlake.
The following dogs at the Lake County Animal Care and Control shelter have been cleared for adoption (additional dogs on the animal control Web site not listed are still “on hold”).
Call Lake County Animal Care and Control at 707-263-0278 or visit the shelter online at http://www.co.lake.ca.us/Government/Directory/Animal_Care_And_Control.htm for information on visiting or adopting.

‘Jack’
“Jack” is a young male Rottweiler mix.
He has a short red and black coat and a docked tail.
He is in kennel No. 22, ID No. 14328.
Border collie mix
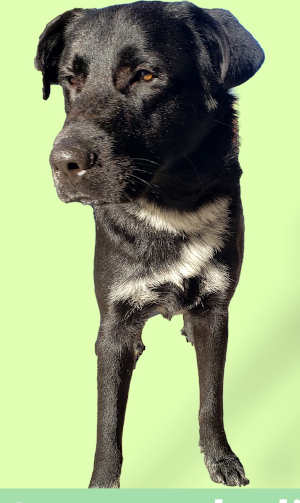
This male border collie mix has a medium-length black coat with white markings.
He is in kennel No. 25, ID No. 14355.

Male pit bull terrier
This male pit bull terrier has a short brindle and white coat.
He is in kennel No. 26, ID No. 14339.

‘Sargent Chunk’
“Sargent Chunk” is a young male Rottweiler with a short red and black coat.
He is in kennel No. 28, ID No. 14303.

Male pit bull terrier
This male pit bull terrier mix has a short black and white coat.
He is in kennel No. 30, ID No. 14338.
Email Elizabeth Larson at
- Details
- Written by: Edward Lempinen
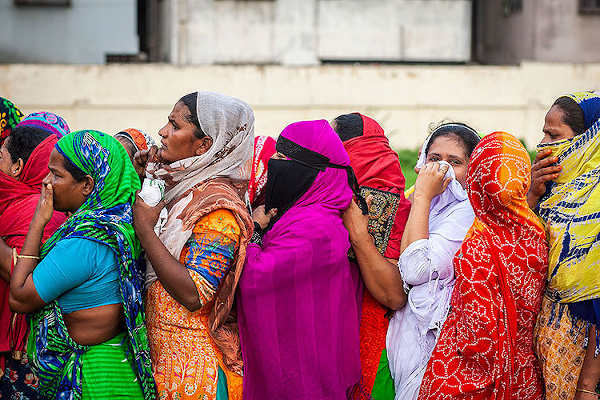
The onset of the COVID-19 pandemic last year led to a devastating loss of jobs and income across the global south, threatening hundreds of millions of people with hunger and lost savings and raising an array of risks for children, according to new research co-authored at the University of California, Berkeley.
The research, published Friday, Feb. 5, in the journal Science Advances, found “staggering” income losses after the pandemic emerged last year, with a median 70 percent of households across nine countries in Africa, Asia and Latin America reporting financial losses.
By April last year, roughly 50 percent or more of those surveyed in several countries were forced to eat smaller meals or skip meals altogether, a number that reached 87 percent for rural households in the West African country of Sierra Leone.
“In the early months of the pandemic, the economic downturn in low- and middle-income countries was almost certainly worse than any other recent global economic crisis that we know of, whether the Asian financial crisis of the late 1990s, the Great Recession that started in 2008, or the more recent Ebola crisis,” said UC Berkeley economist Edward Miguel, a co-author of the study. “The economic costs were just severe, absolutely severe.”
The pandemic has produced some hopeful innovations, including a partnership between the government of Togo in West Africa and UC Berkeley’s Center for Effective Global Action (CEGA) on a system to provide relief payments via digital networks.
But such gains are, so far, isolated.
The new study — the first of its kind globally — reports that after two decades of growth in many low- and middle-income countries, the economic crisis resulting from the COVID-19 pandemic threatens profound long-term impact: Reduced childhood nutrition could have health consequences later in life.
Closed schools may lead to delayed development for some students, while others may simply drop out. When families use their savings to eat, rather than invest in fertilizer or farm improvements, crop yields can decline.
“Such effects can slow economic development in a country or a region, which can lead to political instability, diminished growth or migration,” said Miguel, a co-director at CEGA.
A troubling picture of life during the pandemic
The study was launched in spring 2020, as China, Europe and the U.S. led global efforts to check spread of the virus through ambitious lockdowns of business, schools and transit. Three independent research teams, including CEGA, joined to conduct surveys in the countries where they already worked.
Between April and early July 2020, they connected with 30,000 households, including over 100,000 people, in nine countries with a combined population of 500 million: Burkina Faso, Ghana, Kenya, Rwanda and Sierra Leone in Africa; Bangladesh, Nepal and the Philippines in Asia; and Colombia in South America. The surveys were conducted by telephone.
Reports early in the pandemic suggested that developing countries might be less vulnerable because their populations are so much younger than those in Europe and North America.
But the research teams found that, within weeks after governments imposed lockdowns and other measures to control the virus’s spread, the pandemic was having a pervasive economic impact:
Income fell broadly. In Colombia, 87 percent of respondents nationwide reported lost income in the early phase of the pandemic. Such losses were reported by more than 80% of people nationwide in Rwanda and Ghana.
People struggled to find food. In the Philippines, 77 percent of respondents nationwide said they faced difficulty purchasing food because stores were closed, transport was shut down or food supplies were inadequate. Similar reports came from 68 percent of Colombians and 64% of respondents in Sierra Leone; rates were similar for some communities within other countries.
Food insecurity rose sharply. While the impact was worst in rural Sierra Leone, other communities were hard hit: In Bangladesh, 69 percent of landless agricultural households reported that they were forced to eat less, along with 48 percent of households in rural Kenya.
Children faced increased risk. With schools closed, the risk of educational setbacks rose. Many respondents reported delaying health care, including prenatal care and vaccinations. Some communities reported rising levels of domestic violence.
“The combination of a lengthy period of undernutrition, closed schools, and limited health care may be particularly damaging in the long run for children from poorer households who do not have alternative resources,” the authors wrote.
Miguel’s recent research has focused on economic conditions for poor people in Kenya, and he said people there scrambled to cope with the crisis.
“People moved in with relatives,” he said. “People moved back to their home areas in rural places where there was food. Other people were just relying on the generosity of friends and relatives and co-workers to get by. When you're living on only a couple of dollars a day, and you don't get that money, it's a desperate situation.”
Wealthier countries are also gripped by crisis, but co-author Susan Athey, an economist at Stanford University’s Graduate School of Business, said they’re better able to cope.
“COVID-19 and its economic shock present a stark threat to residents of low- and middle-income countries — where most of the world’s population resides — which lack the social safety nets that exist in rich countries,” Athey said. “The evidence we’ve collected shows dire economic consequences … which, if left unchecked, could thrust millions of vulnerable households into poverty.”
A model of positive, high-impact international partnership
In fact, Miguel said, governments everywhere have struggled to address the health and economic dimensions of the pandemic. In both rich and poor nations, he said, governments have used the pandemic as a reason to crack down on political opponents.
But the crisis has also produced hopeful engagements. The CEGA initiative to support Togolese leaders in developing a system for digital relief payments could be a model for international partnerships.
Under that project, CEGA co-Director Joshua Blumenstock has worked closely with top government officials in Togo to develop an advanced data-driven system for identifying people in need and delivering financial aid. The system uses new computational technologies, with data from satellite imagery, mobile phones and traditional surveys to identify people or communities in economic distress.
CEGA and the GiveDirectly aid organization have just won a $1.2 million grant under the data.org Inclusive Growth and Recovery Challenge to allow further work on the project.
“Over 550,000 Togolese individuals have received cash transfers of roughly $20 a month,” said Lauren Russell, CEGA director of operations. “The grant should allow for the project to be scaled and evaluated even further, with the hope that the methods might be well-suited for adoption by other low- and middle-income countries.”
Global crises require global solutions
Still, Miguel said the disparities between rich and poor nations have been “disheartening.” In North America and Europe, nations may be struggling with vaccination plans, but vaccines have barely arrived in most low-income countries, he said.
“We will not recover in the rich countries until the whole world gets the vaccine and until the crisis is dealt with globally,” he said. “As long as there's active pandemic in parts of the world that's affecting travel and tourism and trade, our economy and our society is going to suffer. If we can spread the wealth in terms of pandemic relief assistance and vaccine distribution, we're all going to get out of this hole faster.”
Edward Lempinen writes for the UC Berkeley News Center.
- Details
- Written by: MILES HATFIELD
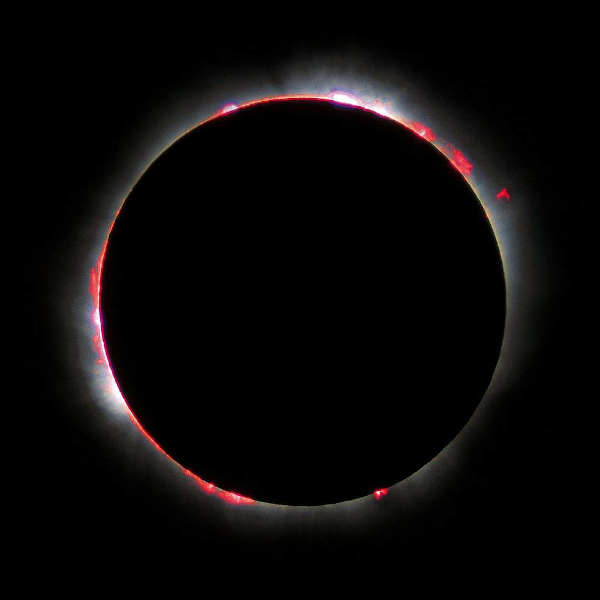
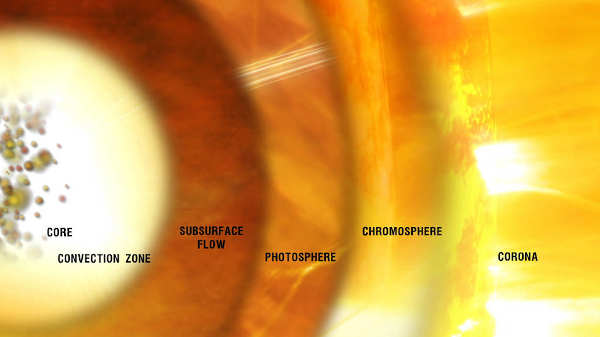
For decades after its discovery, observers could only see the solar chromosphere for a few fleeting moments: during a total solar eclipse, when a bright red glow ringed the Moon’s silhouette.
More than a hundred years later, the chromosphere remains the most mysterious of the Sun’s atmospheric layers. Sandwiched between the bright surface and the ethereal solar corona, the Sun’s outer atmosphere, the chromosphere is a place of rapid change, where temperature rises and magnetic fields begin to dominate the Sun’s behavior.
Now, for the first time, a triad of NASA missions have peered into the chromosphere to return multi-height measurements of its magnetic field. The observations – captured by two satellites and the Chromospheric Layer Spectropolarimeter 2, or CLASP2 mission, aboard a small suborbital rocket – help reveal how magnetic fields on the Sun’s surface give rise to the brilliant eruptions in its outer atmosphere. The paper was published today in Science Advances.
A major goal of heliophysics – the science of the Sun’s influence on space, including planetary atmospheres – is to predict space weather, which often begins on the Sun but can rapidly spread through space to cause disruptions near Earth.
Driving these solar eruptions is the Sun’s magnetic field, the invisible lines of force stretching from the solar surface to space well past Earth. This magnetic field is difficult to see – it can only be observed indirectly, by light from the plasma, or super-heated gas, that traces out its lines like car headlights traveling a distant highway. Yet how those magnetic lines arrange themselves – whether slack and straight or tight and tangled – makes all the difference between a quiet Sun and a solar eruption.
“The Sun is both beautiful and mysterious, with constant activity triggered by its magnetic fields,” said Ryohko Ishikawa, solar physicist at the National Astronomical Observatory of Japan in Tokyo and lead author of the paper.
Ideally, researchers could read out the magnetic field lines in the corona, where solar eruptions take place, but the plasma is way too sparse for accurate readings. (The corona is far less than a billionth as dense as air at sea level.)
Instead, scientists measure the more densely packed photosphere – the Sun’s visible surface – two layers below. They then use mathematical models to propagate that field upwards into the corona. This approach skips measuring the chromosphere, which lies between the two, instead, hoping to simulate its behavior.
Unfortunately the chromosphere has turned out to be a wildcard, where magnetic field lines rearrange in ways that are hard to anticipate. The models struggle to capture this complexity.
“The chromosphere is a hot, hot mess,” said Laurel Rachmeler, former NASA project scientist for CLASP2, now at the National Oceanic and Atmospheric Administration, or NOAA. “We make simplifying assumptions of the physics in the photosphere, and separate assumptions in the corona. But in the chromosphere, most of those assumptions break down.”
Institutions in the U.S., Japan, Spain and France worked together to develop a novel approach to measure the chromosphere’s magnetic field despite its messiness. Modifying an instrument that flew in 2015, they mounted their solar observatory on a sounding rocket, so named for the nautical term “to sound” meaning to measure. Sounding rockets launch into space for brief, few-minute observations before falling back to Earth. More affordable and quicker to build and fly than larger satellite missions, they’re also an ideal stage to test out new ideas and innovative techniques.
Launching from the White Sands Missile Range in New Mexico, the rocket shot to an altitude of 170 miles for a view of the Sun from above Earth’s atmosphere, which otherwise blocks certain wavelengths of light. They set their sights on a plage, the edge of an “active region” on the Sun where the magnetic field strength was strong, ideal for their sensors.
As CLASP2 peered at the Sun, NASA’s Interface Region Imaging Spectrograph or IRIS and the JAXA/NASA Hinode satellite, both watching the Sun from Earth orbit, adjusted their telescopes to look at the same location. In coordination, the three missions focused on the same part of the Sun, but peered to different depths.
Hinode focused on the photosphere, looking for spectral lines from neutral iron formed there. CLASP2 targeted three different heights within the chromosphere, locking onto spectral lines from ionized magnesium and manganese. Meanwhile, IRIS measured the magnesium lines in higher resolution, to calibrate the CLASP2 data. Together, the missions monitored four different layers within and surrounding the chromosphere.
Eventually the results were in: The first multi-height map of the chromosphere’s magnetic field.
“When Ryohko first showed me these results, I just couldn't stay in my seat,” said David McKenzie, CLASP2 principal investigator at NASA’s Marshall Space Flight Center in Huntsville, Alabama. “I know it sounds esoteric – but you've just showed the magnetic field at four heights at the same time. Nobody does that!”
The most striking aspect of the data was just how varied the chromosphere turned out to be. Both along the portion of the Sun they studied and at different heights within it, the magnetic field varied significantly.
“At the Sun’s surface we see magnetic fields changing over short distances; higher up those variations are much more smeared out. In some places, the magnetic field didn't reach all the way up to the highest point we measured whereas in other places, it was still at full strength.”
The team hopes to use this technique for multi-height magnetic measurements to map the entire chromosphere’s magnetic field. Not only would this help with our ability to predict space weather, it will tell us key information about the atmosphere around our star.
“I'm a coronal physicist – I'm really interested in the magnetic fields up there,” Rachmeler said. “Being able to raise our measurement boundary to the top of the chromosphere would help us understand so much more, help us predict so much more – it would be a huge step forward in solar physics.”
They’ll have a chance to take that step forward soon: A re-flight of the mission was just greenlit by NASA. Though the launch date isn’t yet set, the team plans to use the same instrument but with a new technique to measure a much broader swath of the Sun.
“Instead of just measuring the magnetic fields along the very narrow strip, we want to scan it across the target and make a two-dimensional map,” McKenzie said.
Measuring magnetic fields
To measure magnetic field strength, the team took advantage of the Zeeman effect, a century-old technique. (The first application of the Zeeman effect to the Sun, by astronomer George Ellery Hale in 1908, is how we learned that the Sun was magnetic.) The Zeeman effect refers to the fact that spectral lines, in the presence of strong magnetic fields, splinter into multiples. The farther apart they split, the stronger the magnetic field.
The chaotic chromosphere, however, tends to “smear” spectral lines, making it difficult to tell just how far apart they split – that’s why previous missions had trouble measuring it. CLASP2’s novelty was in working around this limitation by measuring “circular polarization,” a subtle shift in the light’s orientation that happens as part of the Zeeman effect.
By carefully measuring the degree of circular polarization, the CLASP2 team could discern how far apart those smeared lines must have split, and thereby how strong the magnetic field was.
Miles Hatfield works for NASA’s Goddard Space Flight Center in Greenbelt, Maryland.
- Details
- Written by: Dr. Glen Holstein
NORTHERN CALIFORNIA – In the early 20th century, grand theories like relativity and quantum mechanics triumphed and came to define science so much that plant ecology felt it needed one of its own to be taken seriously as science.
Frederic Clements helpfully provided one.
His monoclimax theory claimed all vegetation in a climate zone converged to a particular kind called the climatic climax. It seemed to make sense because in its natural state eastern North America it was largely covered by forests from Quebec to Florida and from the Atlantic to eastern Oklahoma.
In the theory, exceptions like abandoned farms, wetlands and rock outcrops were constantly pushed by succession to be covered by forest as well: the region’s climatic climax.
Further west, in a drier climate, a band of nearly treeless grassland that extended from Canada south well into Mexico was the site of dramatic history as cattle were driven north through it from Texas to railroads in Kansas, and eventually to new pastures in Montana as described in “Lonesome Dove.”
Much of what we know as the wild west took place there in the single 1870’s decade from Wyatt Earp’s taming Dodge City to Custer’s defeat at the Little Big Horn. It’s climatic monoclimax, of course, was grassland.
When Clements saw California’s Central Valley, its plains reminded him so much of those in his Nebraska home state, he concluded it must have the same climate.
Consequently, in his climatic climax map, that valley is colored the same yellow as the great plains. And since his theory demanded the same plants in the same climate, he found a few bunch grasses in California related to those in Nebraska and declared them the valley’s original vegetation his theory demanded; even though John Muir 50 years earlier found the still largely undisturbed valley covered with spring and fall wildflowers and very little grass. Despite that, Clements’ bunch grass theory was widely and dogmatically believed until quite recently.
Another plant ecologist W. S. Cooper knew the Central Valley’s climate was nothing like Nebraska but still believed fervently in monoclimaxes. He decided California’s unique climate deserved its own unique climax vegetation and found it in uniquely Californian chaparral shrublands.
And good theorist that he was, Cooper believed chaparral had to be the monoclimax that covered all of California’s distinctive climate zone including the Central Valley, even though no one who had actually been there had ever found anything like that.
But despite scant evidence for Clements’ conclusion about central California and none for Cooper’s, both had their advocates in academic plant ecology throughout the twentieth century since it often practiced what jurists call stare decisis, standing by what’s decided.
Monoclimax was never accepted much in Europe or the rest of the world outside the United States and for good reason. For one, climate is among the least stable of environmental features; hardly one likely to drag vegetation on more stable things like rocks to a monoclimax.
Still, it was significant 50 years ago at UC Davis when a young and soon to be great plant ecology professor Mike Barbour, who tragically passed away late last year, chose the text An Island Called California by an observant amateur Elna Bakker for his classes rather than one by an academic.
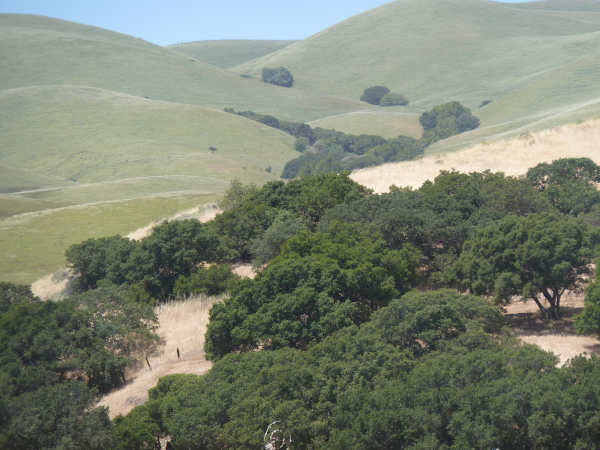
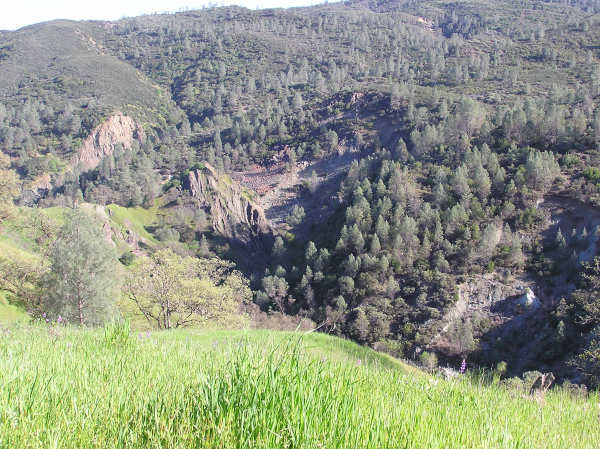
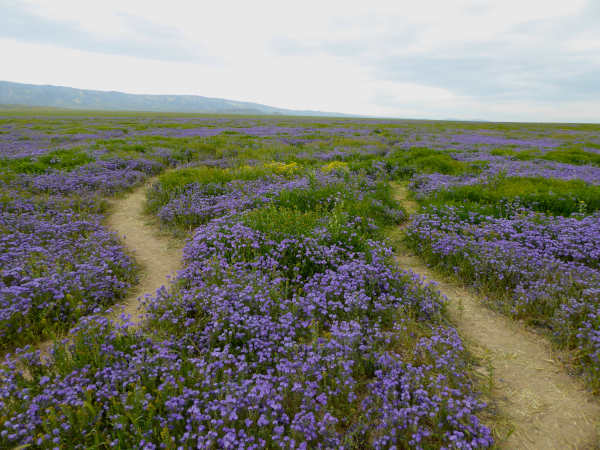
Unobstructed by stare decisis Bakker described a previously unnoticed elephant in the room: California has no single “monoclimax” but is a mosaic of many kinds of vegetation that shifts across landscapes as environmental conditions change.
The reason for this mosaic is quite simple but little discussed or noticed. In California’s Mediterranean type climate rain falls when it’s too cold for much plant growth so water is stored underground for a few months until temperatures warm.
Those months cause underground conditions to be much more important here than east of the Rockies, where monoclimax theory was invented and rain falls when plants are ready to grow.
The greater dependence of vegetation in California on its diverse soils and geology during the months they store water increases its botanical diversity and may even increase its resilience to climate change.
This tale is dedicated to Dr. Michael Barbour, friend and mentor who will be remembered always.
Dr. Glen Holstein is a retired senior scientist from Zentner and Zentner, a Northern California biological consulting company and the Chapter Botanist for the Sacramento Valley Chapter of the California Native Plant Society. He is also on the Board of Tuleyome, a Woodland based nonprofit conservation organization.