 How to resolve AdBlock issue?
News
- Details
- Written by: Lake County News reports
Registration is open through Oct. 1, and the event can be completed any time through and including Oct. 11.
All proceeds go to support the volunteer tutors of the Adult Literacy Program and to purchase books to distribute through the Families for Literacy program, to help break the cycle of illiteracy.
The coalition invites individuals, friends and families who enjoy walking and running to participate, and those who aren’t runners or walkers to donate to our effort to increase literacy skills in Lake County.
“Virtual events have some real advantages in this time of COVID-19,” said Coalition President Deb Ehrhardt. “Instead of a large group all running at the same time, the Virtual Walk/Run for Literacy can be completed any time between Sept. 11 and Oct. 11, 2020. And it can be completed anywhere you choose – in your neighborhood, on a trail, in a park, or even inside on a treadmill. All distances are self-timed, and submitting your result is optional.”
This year, in addition to the 5k run/walk and 10K run, participants can choose any distance they prefer. Children or seniors might prefer a shorter distance; competitive runners a longer distance.
The first 100 people to register receive a free Lake County Literacy Coalition headband.
Participants are encouraged to refer others to the event. “When you register online, you are sent your own identity link which you can send to friends. When four friends register using that specific identifying link, Run Sign Up tallies them and sends an automatic refund after four have registered and paid $25,” said Nancy Hudson, the 2020 race director. “The $20 refund is generated by Run Sign Up and goes directly to the original participant’s credit card.”
Registration fees are $25 per adult (age 19 and over) and $10 per child (ages 7 through 18). Children under age 7 pay no fee and do not need to register.
Online registration is encouraged here; a minimal processing fee applies.
Printed registration/T-shirt order forms can be requested from the Literacy Coalition at
“T-shirts and headbands will be mailed by Nov. 1 to the address you provide to Run Sign Up, or on the printed registration/order form,” said Ginny Cholez, coalition Vice President.
For additional information about the nonprofit Coalition and the Virtual Walk/Run for Literacy, visit the coalition’s website or call 707-263-7633.
- Details
- Written by: Elizabeth Larson
The council will meet beginning at 6 p.m. Thursday, Sept. 17.
Because of the county’s shelter in place order, Clearlake City Hall remains closed to the public, however, the virtual meeting will be broadcast live on the city's YouTube channel or the Lake County PEG TV YouTube Channel. Community members also can participate via Zoom.
The agenda can be found here.
Comments and questions can be submitted in writing for City Council consideration by sending them to Administrative Services Director/City Clerk Melissa Swanson at
To give the council adequate time to review your questions and comments, please submit your written comments prior to 4 p.m. on Thursday, Sept. 17.
Each public comment emailed to the city clerk will be read aloud by the mayor or a member of staff for up to three minutes or will be displayed on a screen. Public comment emails and town hall public comment submissions that are received after the beginning of the meeting will not be included in the record.
At the start of the meeting, the council will meet September’s adoptable dogs and get a presentation from Pacific Gas and Electric Co. on public safety power shutoffs.
The council will then hold the first reading of an ordinance adopting the city’s development impact fee program for transportation.
Also on Thursday, the council will hold the first reading of an ordinance to amend the section of Clearlake Municipal Code relating to commercial cannabis businesses.
City Manager Alan Flora’s report on the item explained that over the past two meetings the council has discussed changes to the city’s commercial cannabis ordinances.
At the Sept. 3 meeting, Flora said the council provided direction to staff to amend the limitations on the number of commercial cannabis businesses, including delivery-only dispensaries, while continuing to limit the location of the businesses based on the Commercial Cannabis Combining District map.
He said the Clearlake Municipal Code limits retail dispensaries in the city to three, delivery-only dispensaries to two and other cannabis businesses – such as those involved in indoor cultivation, distribution, manufacturing and labs – to 12.
Based on council direction at the previous meeting, retail dispensaries would continue to be limited to three while delivery-only dispensaries and other cannabis businesses wouldn’t be limited on the basis of numbers but on locations on the city’s Commercial Cannabis Combining District map, Flora said.
If the council holds and approves the first reading of the new ordinance, it would be brought back for a second and final reading at the Oct. 1 meeting.
The council also is set to consider awarding a contract to the California Engineering Co. for professional engineering services in the amount of $455,000 for the Sulphur Fire Road Rehabilitation Project.
Director of Public Works Dale Goodman’s report to the council said that the project area is San Joaquin from Arrowhead to Gooseneck, and on Lakeshore from Olympic to Oak. “Most of the smaller roads within the fire area will also be included in the project for a total of approximately 10 miles of work. Design will include guardrail and storm water improvements along both roads.”
The total Sulphur Fire Road Rehabilitation project is expected to be approximately $10 million, Goodman said.
Goodman said the funds for the engineering contract will come from the PG&E Sulphur Fire litigation.
In council business, the council will consider adding a radio voting receiver site for the police department, take up the adoption of a third amendment to the Fiscal Year 2020-21 budget to appropriate funding for professional services, equipment and supplies, and discuss the 2020 League of California Cities Annual Conference resolutions.
On the meeting's consent agenda – items that are not considered controversial and are usually adopted on a single vote – are warrant registers; minutes of the Aug. 12 Lake County Vector Control meeting; ratification of purchases of a Bobcat Toolcat 5600 with accessories and used K-Rail barrier; acceptance for filing the 2020 Local Agency biennial notice regarding amendments to the conflict of interest code; consideration of rejection of bids for the Austin Park Bus Stop Renovation/Relocation Project.
Email Elizabeth Larson at
- Details
- Written by: JOHN CREAMER
Poverty rates declined between 2018 and 2019 for all major race and Hispanic origin groups.
Two of these groups, Blacks and Hispanics, reached historic lows in their poverty rates in 2019. The poverty rate for Blacks was 18.8 percent; for Hispanics, it was 15.7 percent.
The historically low poverty rates for Blacks and Hispanics in 2019 reflect gains for race and Hispanic origin groups that have traditionally been disadvantaged compared to other groups over time.
These estimates, released today, are from the Current Population Survey Annual Social and Economic Supplement, or CPS ASEC.
Changes in surveys over time can make historical comparisons difficult. Using a methodology proposed last year, we can adjust the historical series to account for statistically significant impacts of recent CPS ASEC survey redesigns.
The figure below charts historical poverty rates for each of the major race and Hispanic origin groups and Hispanics in the CPS ASEC.
Adjustments are made for Asians, Blacks and non-Hispanic Whites because the recent survey changes resulted in statistically significant changes in poverty rates. Poverty rates for Hispanics are not adjusted because the survey changes did not result in statistically different poverty rates.
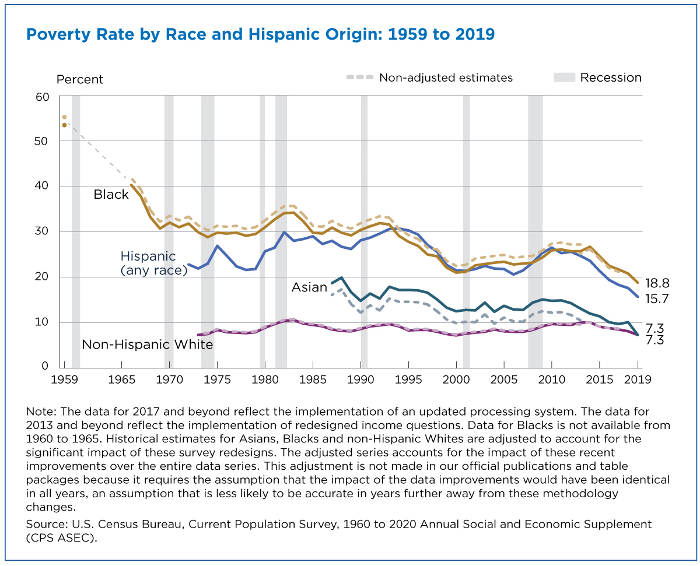
The figure shows that for Blacks, the poverty rate of 18.8 percent in 2019 was the lowest rate observed since poverty estimates were first produced for this group for 1959. The previous low for this group was 20.8 percent in 2018.
Poverty rates in 2019 were also the lowest ever observed for Hispanics (15.7 percent), compared to the prior low of 17.6 percent in 2018. Poverty statistics for Hispanics date back to 1972.
The Asian poverty rate of 7.3 percent was also the lowest on record.
The 2019 poverty rate of 7.3 percent for non-Hispanic Whites was not statistically different than the previous low (historically adjusted) of 7.2 percent in 2000 and 7.3 percent in 1973.
Distribution of poverty by race and Hispanic origin
The historically low poverty rates for Blacks and Hispanics in 2019 reflect gains for race and Hispanic origin groups that have traditionally been disadvantaged compared to other groups over time.
However, even with these gains, Blacks and Hispanics continue to be over-represented in the population in poverty relative to their representation in the overall population.
The figure below shows the ratio of people in poverty by race or Hispanic origin group to each group’s share of the total population.
If the poverty population is perfectly proportional to the total population, we would expect the ratio to be 1.0. If a group is over-represented in poverty, the ratio will be greater than 1.0. If the ratio is less than 1.0, the group is under-represented in poverty.
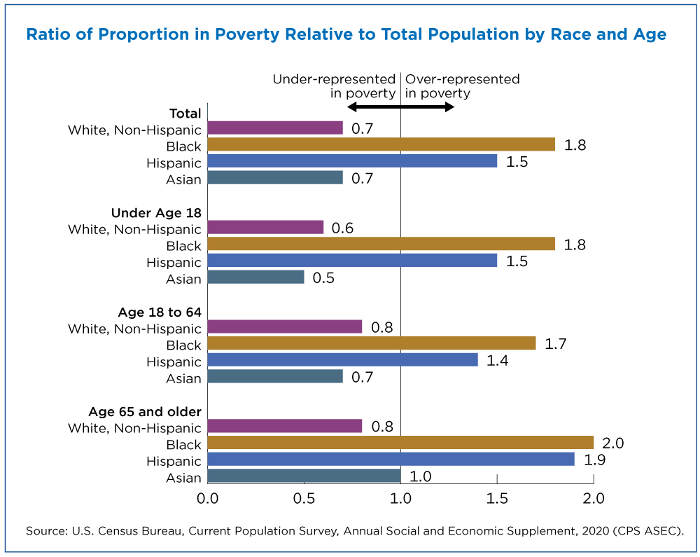
In 2019, the share of Blacks in poverty was 1.8 times greater than their share among the general population. Blacks represented 13.2 percent of the total population in the United States, but 23.8 percent of the poverty population.
The share of Hispanics in poverty was 1.5 times more than their share in the general population. Hispanics comprised 18.7 percent of the total population, but 28.1 percent of the population in poverty.
In contrast, non-Hispanic Whites and Asians were under-represented in the poverty population.
Non-Hispanic Whites made up 59.9 percent of the total population but only 41.6 percent of the population in poverty. Asians made up 6.1 percent of the population and 4.3 percent of the population in poverty.
These disparities are especially pronounced among children and people ages 65 and older.
The share of Non-Hispanic White and Asian children in poverty was about half of their share in the general population. Among people ages 65 and over, the shares of Blacks and Hispanics in poverty were approximately twice their share in the general population.
Time trends
The figure below shows that over time, non-Hispanics Whites have consistently been under-represented among the population in poverty, while Blacks and Hispanics have consistently been over-represented. Asians have been under-represented in poverty for the last 20 years.
The adjustment for survey changes is not made here for simplicity.
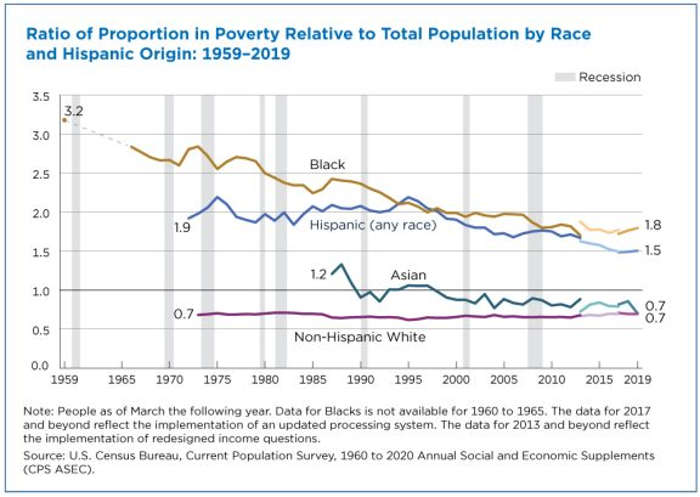
The figure shows that there has been a gradual decrease in the degree of over-representation of Blacks and Hispanics in poverty.
After the Great Recession ended in June 2009, the degree of overrepresentation stayed level for Blacks, while the ratio moved closer to one for Hispanics, continuing a trend which started in the mid-1990s.
One potential reason for the recent trend is that since 2008, median household income for Blacks has grown at a slower rate than median household income for Hispanics.
The figure below tracks median household income using 2019 dollars from 2008, the last full year of the most recent recession, until 2019.
Like Figure 1, the series below implements adjustments to the estimates for groups whose median household incomes were statistically changed by the survey improvements.
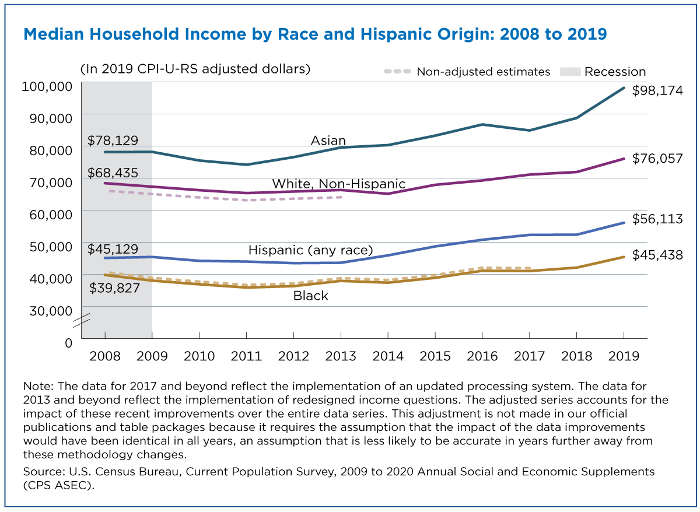
In 2019, median household income for Black households was $45,438 compared to $56,113 for Hispanic households, $76,057 for non-Hispanic White households, and $98,174 for Asian households.
Since 2008, median household income increased 14.1 percent for Black households, compared to 24.3 percent for Hispanic households, 11.1 percent for non-Hispanic White households, and 25.7 percent for Asian households.
For more information on year-to-year poverty changes and household income, see Income and Poverty in the United States: 2019.
John Creamer is an economist in the Census Bureau’s Poverty Statistics Branch.
- Details
- Written by: NATIONAL AERONAUTICS AND SPACE ADMINISTRATION
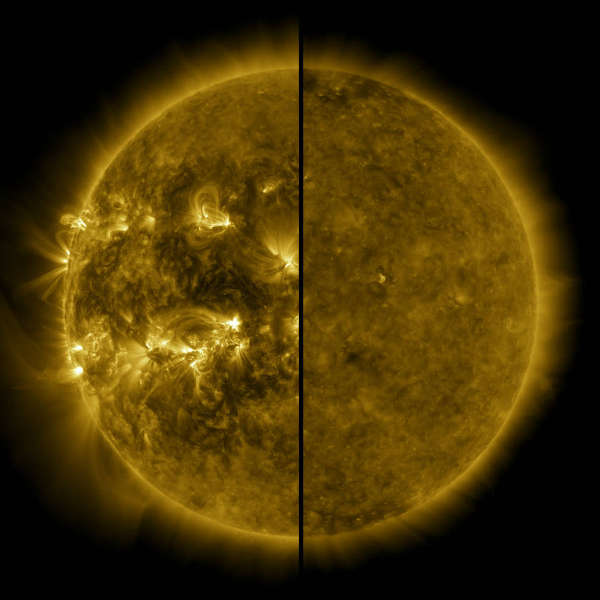
Solar Cycle 25 has begun. During a media event on Tuesday, experts from NASA and the National Oceanic and Atmospheric Administration, or NOAA, discussed their analysis and predictions about the new solar cycle – and how the coming upswing in space weather will impact our lives and technology on Earth, as well as astronauts in space.
The Solar Cycle 25 Prediction Panel, an international group of experts co-sponsored by NASA and NOAA, announced that solar minimum occurred in December 2019, marking the start of a new solar cycle.
Because our sun is so variable, it can take months after the fact to declare this event. Scientists use sunspots to track solar cycle progress; the dark blotches on the sun are associated with solar activity, often as the origins for giant explosions – such as solar flares or coronal mass ejections – which can spew light, energy and solar material into space.
“As we emerge from solar minimum and approach Cycle 25’s maximum, it is important to remember solar activity never stops; it changes form as the pendulum swings,” said Lika Guhathakurta, solar scientist at the Heliophysics Division at NASA Headquarters in Washington.
NASA and NOAA, along with the Federal Emergency Management Agency and other federal agencies and departments, work together on the National Space Weather Strategy and Action Plan to enhance space weather preparedness and protect the nation from space weather hazards.
NOAA provides space weather predictions and satellites to monitor space weather in real-time; NASA is the nation’s research arm, helping improve our understanding of near-Earth space, and ultimately, forecasting models.
Space weather predictions are also critical for supporting Artemis program spacecraft and astronauts. Surveying this space environment is the first step to understanding and mitigating astronaut exposure to space radiation.
The first two science investigations to be conducted from the Gateway will study space weather and monitor the radiation environment in lunar orbit. Scientists are working on predictive models so they can one day forecast space weather much like meteorologists forecast weather on Earth.
“There is no bad weather, just bad preparation,” said Jake Bleacher, chief scientist for NASA’s Human Exploration and Operations Mission Directorate at the agency’s Headquarters. “Space weather is what it is – our job is to prepare.”
Understanding the cycles of the sun is one part of that preparation. To determine the start of a new solar cycle, the prediction panel consulted monthly data on sunspots from the World Data Center for the Sunspot Index and Long-term Solar Observations, located at the Royal Observatory of Belgium in Brussels, which tracks sunspots and pinpoints the solar cycle’s highs and lows.
“We keep a detailed record of the few tiny sunspots that mark the onset and rise of the new cycle,” said Frédéric Clette, the center’s director and one of the prediction panelists. “These are the diminutive heralds of future giant solar fireworks. It is only by tracking the general trend over many months that we can determine the tipping point between two cycles.”
With solar minimum behind us, scientists expect the sun’s activity to ramp up toward the next predicted maximum in July 2025. Doug Biesecker, panel co-chair and solar physicist at NOAA’s Space Weather Prediction Center, or SWPC, in Boulder, Colorado, said Solar Cycle 25 is anticipated to be as strong as the last solar cycle, which was a below-average cycle, but not without risk.
“Just because it’s a below-average solar cycle, doesn’t mean there is no risk of extreme space weather,” Biesecker said. “The sun’s impact on our daily lives is real and is there. SWPC is staffed 24/7, 365 days a year because the sun is always capable of giving us something to forecast.”
Elsayed Talaat, director of Office of Projects, Planning, and Analysis for NOAA’s Satellite and Information Service in Silver Spring, Maryland, described the nation’s recent progress on the Space Weather Action Plan as well as on upcoming developments, including NOAA’s Space Weather Follow-On L-1 observatory, which launches in 2024, before Solar Cycle 25’s predicted peak.
“Just as NOAA’s National Weather Service makes us a weather-ready nation, what we’re driving to be is a space weather-ready nation,” Talaat said. “This is an effort encompassing 24 agencies across the government, and it has transformed space weather from a research perspective to operational knowledge.”
For more information on NASA programs and activities, visit https://www.nasa.gov.