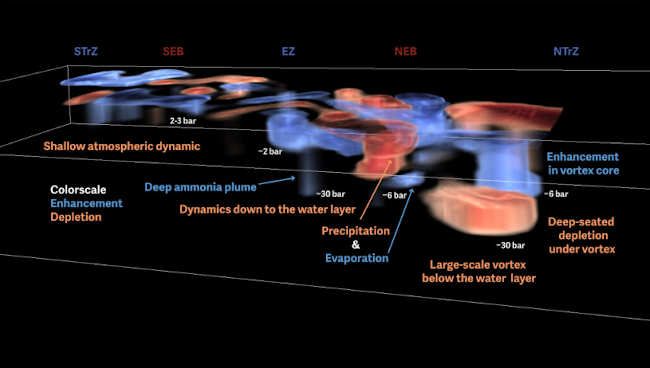
A cross section of the upper atmosphere, or troposphere, of Jupiter, showing the depth of storms in a north-south swath that crosses the planet's equator, or equatorial zone (EZ). Blue and red represent, respectively, higher- and lower-than-normal abundances of ammonia gas. By tracking the ammonia, two new UC Berkeley studies show that the rapidly changing weather systems on Jupiter are mostly very shallow (left), though two types of storms — rapidly rising plumes of ammonia (center) and tornado-like vortices — punch more deeply and are responsible for unmixing atmospheric gases. Large-scale storms produce mushballs that rain downward even deeper than the plumes and vortices. (Graphic credit: Chris Moeckel, UC Berkeley.) Imagine a Slushee composed of ammonia and water encased in a hard shell of water ice. Now picture these ice-encrusted slushballs, dubbed "mushballs," raining down like hailstones during a thunderstorm, illuminated by intense flashes of lightning.
Planetary scientists at the University of California, Berkeley, now say that hailstorms of mushballs accompanied by fierce lightning actually exist on Jupiter. In fact, mushball hailstorms may occur on all gaseous planets in the galaxy, including our solar system's other giant planets, Saturn, Uranus and Neptune.
The idea of mushballs was initially put forth in 2020 to explain nonuniformities in the distribution of ammonia gas in Jupiter's upper atmosphere that were detected both by NASA's Juno mission and by radio telescopes on Earth.
At the time, UC Berkeley graduate student Chris Moeckel and his adviser, Imke de Pater, professor emerita of astronomy and of earth and planetary science, thought the theory too elaborate to be real, requiring highly specific atmospheric conditions.
"Imke and I both were like, ‘There's no way in the world this is true,’" said Moeckel, who received his UC Berkeley Ph.D. last year and is now a researcher at UC Berkeley's Space Sciences Laboratory. "So many things have to come together to actually explain this, it seems so exotic. I basically spent three years trying to prove this wrong. And I couldn't prove it wrong."
The confirmation, reported March 28 in the journal Science Advances, emerged together with the first 3D visualization of Jupiter's upper atmosphere, which Moeckel and de Pater recently created and describe in a paper that is now undergoing peer review and is posted on the preprint server arXiv.
The 3D picture of Jupiter's troposphere shows that the majority of the weather systems on Jupiter are shallow, reaching only 10 to 20 kilometers below the visible cloud deck or “surface” of the planet, which has a radius of 70,000 km. Most of the colorful, swirling patterns in the bands that encircle the planet are shallow.
Some weather, however, emerges much deeper in the troposphere, redistributing ammonia and water and essentially unmixing what was long thought to be a uniform atmosphere. The three types of weather events responsible are hurricane-like vortices, hotspots coupled to ammonia-rich plumes that wrap around the planet in a wave-like structure, and large storms that generate mushballs and lightning.
"Every time you look at Jupiter, it's mostly just surface level," Moeckel said. "It's shallow, but a few things — vortices and these big storms — can punch through."
"Juno really shows that ammonia is depleted at all latitudes down to about 150 kilometers, which is really odd," said de Pater, who discovered 10 years ago that ammonia was depleted down to about 50 km. "That's what Chris is trying to explain with his storm systems going much deeper than we expected."
Inferring planet composition from observations of clouds
Gas giants like Jupiter and Saturn and ice giants like Neptune and Uranus are a major focus of current space missions and large telescopes, including the James Webb Space Telescope, in part because they can help us understand the formation history of our solar system and ground truth observations of distant exoplanets, many of which are large and gaseous. Since astronomers can see only the upper atmospheres of faraway exoplanets, knowing how to interpret chemical signatures in these observations can help scientists infer details of exoplanet interiors, even for Earth-like planets.
"We're basically showing that the top of the atmosphere is actually a pretty bad representative of what is inside the planet," Moeckel said.
That's because storms like those that create mushballs unmix the atmosphere so that the chemical composition of the cloud tops does not necessarily reflect the composition deeper in the atmosphere. Jupiter is unlikely to be unique.
"You can just extend that to Uranus, Neptune — certainly to exoplanets as well," de Pater said.
The atmosphere on Jupiter is radically different from that on Earth. It's primarily made of hydrogen and helium gas with trace amounts of gaseous molecules, like ammonia and water, which are heavier than the bulk atmosphere. Earth's atmosphere is mainly nitrogen and oxygen. Jupiter also has storms, like the Great Red Spot, that last for centuries. And while ammonia gas and water vapor rise, freeze into droplets, like snow, and rain down continually, there is no solid surface to hit. At what point do the raindrops stop falling?
"On Earth, you have a surface, and rain will eventually hit this surface," Moeckel said. "The question is: What happens if you take the surface away? How far do the raindrops fall into the planet? This is what we have on the giant planets."
That question has piqued the interest of planetary scientists for decades, because processes like rain and storms are thought to be the main vertical mixers of planetary atmospheres. For decades, the simple assumption of a well-mixed atmosphere guided inferences about the interior makeup of gas giant planets like Jupiter.
Observations by radio telescopes, much of it conducted by de Pater and colleagues, show that this simple assumption is false.
"The turbulent cloud tops would lead you to believe that the atmosphere is well mixed," said Moeckel, invoking the analogy of a boiling pot of water. "If you look at the top, you see it boiling, and you would assume that the whole pot is boiling. But these findings show that even though the top looks like it’s boiling, below is a layer that really is very steady and sluggish."
The microphysics of mushballs
On Jupiter, the majority of water rain and ammonia snow appears to cycle high up in the cold atmosphere and evaporate as it falls, Moeckel said. Yet, even before Juno's arrival at Jupiter, de Pater and her colleagues reported an upper atmosphere lacking in ammonia. They were able to explain these observations, however, through dynamic and standard weather modeling, which predicted a rainout of ammonia in thunderstorms down to the water layer, where water vapor condenses into a liquid.
But radio observations by Juno traced the regions of poor mixing to much greater depths, down to about 150 km, with many areas puzzlingly depleted of ammonia and no known mechanism that could explain the observations. This led to proposals that water and ammonia ice must form hailstones that fall out of the atmosphere and remove the ammonia. But it was a mystery how hailstones could form that were heavy enough to fall hundreds of kilometers into the atmosphere.
To explain why ammonia is missing from parts of Jupiter’s atmosphere, planetary scientist Tristan Guillot proposed a theory involving violent storms and slushy hailstones called mushballs. In this idea, strong updrafts during storms can lift tiny ice particles high above the clouds — more than 60 kilometers up. At those altitudes, the ice mixes with ammonia vapor, which acts like antifreeze and melts the ice into a slushy liquid. As the particles continue to rise and fall, they grow larger — like hailstones on Earth — eventually becoming mushballs the size of softballs.
These mushballs can trap large amounts of water and ammonia with a 3 to 1 ratio. Because of their size and weight, they fall deep into the atmosphere — well below where the storm started — carrying the ammonia with them. This helps explain why ammonia appears to be missing from the upper atmosphere: it’s being dragged down and hidden deep inside the planet, where it leaves faint signatures to be observed with radio telescopes.
However, the process depends on a number of specific conditions. The storms need to have very strong updrafts, around 100 meters per second, and the slushy particles must quickly mix with ammonia and grow large enough to survive the fall.
"The mushball journey essentially starts about 50 to 60 kilometers below the cloud deck as water droplets. The water droplets get rapidly lofted all the way to the top of the cloud deck, where they freeze out and then fall over a hundred kilometers into the planet, where they start to evaporate and deposit material down there," Moeckel said. "And so you have, essentially, this weird system that gets triggered far below the cloud deck, goes all the way to the top of the atmosphere and then sinks deep into the planet."
Unique signatures in the Juno radio data for one storm cloud convinced him and his colleagues that this is, indeed, what happens.
"There was a small spot under the cloud that either looked like cooling, that is, melting ice, or an ammonia enhancement, that is, melting and release of ammonia," Moeckel said. "It was the fact that either explanation was only possible with mushballs that eventually convinced me."
The radio signature could not have been caused by water raindrops or ammonia snow, according to paper co-author Huazhi Ge, an expert in cloud dynamics on giant planets and a postdoctoral fellow at the California Institute of Technology in Pasadena.
"The Science Advances paper shows, observationally, that this process apparently is true, against my best desire to find a simpler answer," Moeckel said.
Coordinated observations of Jupiter
Scientists around the world observe Jupiter regularly with ground-based telescopes, timed to coincide with Juno's closest approach to the planet every six weeks. In February 2017 and April 2019 — the periods covered by the two papers — the researchers used data from both the Hubble Space Telescope (HST) and the Very Large Array (VLA) in New Mexico to complement Juno observations in an attempt to create a 3D picture of the troposphere.
The HST, at visible wavelengths, provided measurements of reflected light off the cloud tops, while the VLA, a radio telescope, probed tens of kilometers below the clouds to provide global context. Juno's Microwave Radiometer explored the deep atmosphere of Jupiter over a limited region of the atmosphere.
"I essentially developed a tomography method that takes the radio observations and turns them into a three-dimensional rendering of that part of the atmosphere that is seen by Juno," Moeckel said.
The 3D picture of that one swath of Jupiter confirmed that most of the weather is happening in the upper 10 kilometers.
"The water condensation layer plays a crucial role in controlling the dynamics and the weather on Jupiter," Moeckel said. “Only the most powerful storms and waves can break through that layer.
Moeckel noted that his analysis of Jupiter’s atmosphere was delayed by the lack of publicly available calibrated data products from the Juno mission. Given the current level of data released, he was forced to independently reconstruct the mission team’s data processing methods — tools, data and discussions that, if shared earlier, could have significantly accelerated independent research and broadened scientific participation. He has since made these resources publicly available to support future research efforts.
The work was funded in part by a Solar System Observations (SSO) award from NASA (80NSSC18K1003).
Robert Sanders writes for the UC Berkeley News Center.
MIDDLETOWN, Calif. — At a California Public Utilities Commission workshop, Lake County leaders, alongside regional officials, discussed concerns over communication in rural California and called for continuous landline services to the region.
The California Public Utilities Commission, or CPUC, held panel discussions at Twin Pine Hotel and Casino on April 4 with tribal, public safety and rural county leadership as part of a rulemaking proceeding on carrier of last resort.
The workshop was the first in a series of public participation events focused on potential changes to the rulemaking proceeding, which could affect landline services across the state.
Speakers throughout the day emphasized the essential role of reliable landline service in rural California, where cell towers are sparse, weather conditions are challenging, more residents rely on copper lines and public safety depends on having redundant communication systems — especially during emergencies like wildfires, floods and power outages.
Lake County District 5 Supervisor Jessica Pyska, Sheriff Luke Bingham and Middletown Rancheria of Pomo Indians Chairman Moke Simon joined state officials and leaders of other tribes and counties — including Mendocino, Inyo, Nevada and San Mateo — in the discussion.
A carrier of last resort, often referred to as COLR, is a telecommunications provider obligated to offer basic phone service — typically landline service — to any customer within a designated area.
AT&T is the designated COLR in much of California, including Lake County, and is the largest one in the state.
In 2023, AT&T California filed an application requesting relief from its obligations. The CPUC rejected the application in June 2024.
During the review process, the Lake County Board of Supervisors submitted a letter to CPUC, opposing AT&T’s request, warning of “considerable dangers” to residents who rely solely on landlines and lack alternative communication options.
Also in June 2024, the CPUC opened a new proceeding to consider making changes to the current COLR rules.
Current rules state that a COLR cannot end its service obligations unless another provider assumes the responsibility. Changes to such rules could affect the conditions of COLR withdrawal.
“A company that is no longer designated as COLR could stop providing basic service,” CPUC says in a fact sheet regarding the rulemaking.
Communication ‘redundancy’ is key for public safety and personal emergencies
Public safety panelists emphasized the importance of communication “redundancy” during emergencies, stressing the need for multiple methods in rugged rural areas where cell coverages are sparse and unreliable.
They noted that copper infrastructure and landline services remain critical, even alongside modern wireless systems.
“We're a very rural community, we're a very rugged community in different areas, and that causes a lot of communication problems within our communities, even within our own dispatch system,” said Lake County Sheriff Bingham, adding that there were times when radio or cell phone systems broke down.
“So our goal within the OES [Office of Emergency Services] branch of the sheriff's office in the county is to always have those redundant systems of notification and communication within the county,” Bingham said.
Speakers made references to wildfire disasters when communication was challenging and dependable landlines were key.
“During the 2017 wildfires, we had our copper lines,” said Mendocino County Sheriff Matthew Kendall. “The poles had been burned and they were laying on the ground, but I was still able to make it to a fire department, pick up a landline, dial it and connect with Cal Fire.”
He added, “These layers — this redundancy that we have in place — is very, very important for first responders from the beginning to the end of an event.”
Kendall then pointed to two things that have “historically worked” in Mendocino that he still thought are important today: local radio and copper lines, which he personally still keeps at home.
"If we remove one of those layers, the devil's in the details on some of these things," Kendall said, adding that these systems are essential not only during wildfires, but also in everyday emergencies — like when someone falls off a ladder or during a public safety power shutoff.
“Without the ability to make a phone call, contact 911, contact EMS [emergency medical services] or fire or the sheriff's office,” he said, “people are going to suffer, and so that's a huge concern for me, if we start taking things off the plate that have historically worked for us.”
Having multiple communication methods available is also important for first responders to locate callers.
“Worst case — the fiber connection burns up and there's no redundant path for the VoIP customer to be able to call, you're not going to know where they're at,” said Paul Troxel, 911 Branch Manager of the California Governor’s Office of Emergency Services, or Cal OES.
“The cell coverage here is very spotty,” said Supervisor Pyska later in the rural county officials panel.
She referenced medically fragile constituents who only have a landline, residents who do not have access to cell service despite living in a populated community, and those who live in an area that suffers from regular floods.
“These are the people that I’m really, really concerned about,” she said. “This is not an unusual story.”
Potential for a ‘drastic negative impact on public safety’
Each year, more than 26 million 911 calls are received statewide, according to Troxel. Of those, 87% come from a wireless device, about 4% come from a “plain old telephone POTS line” and about 6% from a VoIP line, he said.
Sheriff Bingham later added that in Lake County, his dispatch center receives 35,000 to 38,000 calls of 911 every year.
If landline communication is taken away from the residents, “that’s still a large amount of 911 calls that we would not be able to receive and respond to,” Bingham said of the 1,400 to 1,520 calls based on the 4% estimate.
While Troxel clarified that the percentage was an aggregated state data and he did not have the data specific to rural areas, it could be a much bigger number, said Andrew White, chief of Martinez Police, who left the city of Clearlake as the police chief in 2022.
“I would suspect the percentages are a lot higher as you go to the rural areas,” said White, reiterating the importance of providing “redundancy” in the area.
“It’s pretty few and far between that you can get access to fiber infrastructure,” White said.
Toward the end of the panel discussion, the CPUC asked how it could minimize impacts to public safety if the commission does determine that “some areas may not require a designated COLR obligation.”
“I think that is the million dollar question — if these services go away, what will be there?” Kendall said.
“I think especially in Lake County, just knowing the geography of Lake County, I think the investment in the infrastructure to cover the areas that are currently covered by copper lines would far exceed what the current cost is for those copper lines,” Bingham said.
“I think you could see a drastic negative impact on public safety, if just suddenly tomorrow it’s decided that this isn’t there,” White said of the potential changes in the rulemaking. “I think it needs to be done over time.”
Kendall mentioned that various telecommunication companies have coverage maps for cell service that do not accurately reflect their actual coverage.
“Although they look good when I look at them, a lot of them make me laugh — because they will have full coverage in places where I've been standing just two days prior, unable to make any phone calls,” Kendall said.
“It’s got to be boots on the ground and actually go test it — go test it,” he said.
Email staff reporter Lingzi Chen at This email address is being protected from spambots. You need JavaScript enabled to view it..
LAKE COUNTY, Calif. — The Lake County Economic Development Corp., or LCEDC, has been selected as a Catalyst awardee through the Redwood Region RISE initiative meant to improve health care.
With an investment of $650,000, LCEDC will advance the development of the Lake County Healthcare Education and Simulation Center — also known as the Health Education and Regional Training, or HEART, Hub — a transformative project designed to address workforce shortages and elevate health care training opportunities in Lake County and the broader Redwood Region.
“This award marks a significant step in our commitment to strengthening Lake County’s health care infrastructure and workforce development,” said Tim Stephens, CEO of Sutter Lakeside Hospital. “Through state-of-the-art simulation facilities, we are equipping future health care professionals with the hands-on skills needed to serve our communities, ensuring sustainable job growth and improved health outcomes.”
As part of the Catalyst Awards program, which allocates over $8.1 million in funding to support high-impact economic development projects, LCEDC’s initiative aligns with Redwood Region RISE’s 10-year Regional Roadmap.
The awards prioritize projects that foster inclusive economic development, particularly in priority and disinvested communities, with over 70% of funding directed to such initiatives.
LCEDC is collaborating with leading industry partners and educational institutions to ensure the success and long-term sustainability of the HEART Hub. The organization said these partnerships provide essential expertise, resources, and curriculum development to enhance workforce training in Lake County.
Partners include:
• Sutter Health, Lake County Tribal Health Consortium, Adventist Health Clearlake, Partnership Healthplan of California, Hospital Council of Northern and Central California: Clinical expertise and workforce development support.
• Lake County Office of Education, Mendocino County Office of Education, Mendocino College, Woodland College, Mendocino Lake Adult and Career Education Consortium, Lake and Mendocino Schools, Redwood Coast K16 Educational Collaborative, Sonoma State University: Health care curriculum design and simulation training.
• Workforce Alliance of the North Bay: Career pathways and job placement initiatives.
• Lake County Chamber of Commerce, county of Lake, MotherWise: Community and government support.
By engaging with local health care providers, educational institutions, and workforce development leaders, LCEDC is ensuring that the center serves as a pipeline for well-trained professionals entering the health care industry.
The HEART Hub contributes to the roadmap’s focus on health and caregiving, reinforcing regional health care resilience and expanding career pathways for local workers.
By offering advanced training programs and simulation-based learning, the project helps address critical workforce shortages while preparing health care professionals to meet the evolving needs of our community.
As part of this initiative, LCEDC and the HEART Hub partners remain committed to collaborating with local, state and federal partners to secure further investment and amplify the long-term impact of this program.
With implementation expected to begin in May 2025 and completion set for September 2026, LCEDC is eager to drive innovation, expand training opportunities, and position Lake County as a hub for health care education.
Whether GDP swings up or down, there are limits to what it says about the economy and your place in it
The price of eggs might mean more to some Americans than what’s going on with GDP. Scott Olson/Getty Images
The Bureau of Economic Analysis released the latest U.S. gross domestic product data on April 30. In the first three months of 2025, it said, GDP contracted by 0.3%. The GDP growth rate captures the pace at which the total value of goods and services grows or shrinks. Together with unemployment and inflation, it usually receives a lot of attention as an indicator of economic performance.
Some economists and analysts said the economy might not be as bad as this rate’s decline might suggest. While this is the first time in three years that GDP has shrunk instead of growing, it is a relatively small decline.
This raises a critical question: Does a relatively small GDP contraction mean the economy is in trouble? I have spent much of my working life studying economic well-being at the level of individuals or families.
What I’ve learned can offer a different lens on the economy than you’d get from just focusing on the most popular indicators, such as the GDP growth rate.
GDP problems
The GDP growth rate has many limitations as an economic indicator. It captures only a very narrow slice of economic activity: goods and services. It pays no attention to what is produced, how it is produced or how people assess their economic lives.
GDP gets a lot of attention, in part, because of the misconception that economics only has to do with market transactions, money and wealth. But economics is also about people and their livelihoods.
Many economists would agree that economics treats wealth or the production of goods and services as means to improve human lives.
Since the 1990s, a number of international commissions and research projects have come up with ways to go beyond GDP. In 2008, the French government asked two Nobel Prize winners, Joseph Stiglitz and Amartya Sen, as well as the late economist Jean-Paul Fitoussi, to put together an international commission of experts to come up with new ways to measure economic performance and progress. In their 2010 report, they argued that there is a need to “shift emphasis from measuring economic production to measuring people’s well-being.”
Considering complementary metrics
One approach is to use a composite index that combines data on a variety of aspects of a country’s well-being into a single statistic. That one number could unfold into a detailed picture of the situation of a country if you zoom into each underlying indicator, by demographic group or region.
The production of such composite indices has flourished. For example, the Human Development Index of the United Nations, started in 1990, covers income per capita, life expectancy at birth and education. This index shows how focusing on GDP alone can mislead the public about a country’s economic performance.
In 2024, the U.S. ranked fifth in the world in terms of GDP per capita, but was in 20th place on the Human Development Index due to relatively lower life expectancy and years of schooling compared to other countries at the top of the list, like Switzerland and Norway.
Monitoring other indicators
Another approach is to rely on a larger number of indicators that are frequently updated. These other data points reflect a variety of perspectives about the economy, including subjective ones that convey personal perceptions and experiences.
For instance, in addition to inflation rates, there is data on stress due to inflation as well as inflation expectations. Both offer insights into people’s perceptions, perspectives and experiences about inflation.
During the COVID-19 pandemic, the annual U.S. inflation rate increased from 1% in July 2020 to 8.5% in July 2022. My research partners and I found, using U.S. Census data, that more than 3 in 4 adults in the U.S. were experiencing moderate or high levels of stress due to inflation at that time and continued to do so even after inflation went down in 2023.
More recently, the Trump administration’s sporadic tariff changes have made future prices more uncertain, which exposes people to risks. That, in turn, makes people adjust their expectations and feel worse off.
Consumers also have negative expectations about their own future income and worry about their own economic status.
At this moment, the U.S. economy has not officially entered a recession – which requires a longer period of GDP contraction than just one quarter. Although unemployment and inflation rates remain relatively low, the broad picture of the economy that takes into account people’s expectations and perceptions is troubling. To be clear, I’m not saying that just because of what the GDP data may indicate.
 How to resolve AdBlock issue?