How to resolve AdBlock issue?
News
- Details
- Written by: Lake County News reports
The agency said the results for the primary posted so far are not final, with the Elections Office now in the midst of the 30-day official canvass period.
As of Friday, still to be counted were 8,059 vote-by-mail ballots, 266 provisional/conditional ballots and 149 vote-by-mail ballots that require further review for various reasons, for a grand total of 8,474 ballots.
In addition, the Registrar of Voters Office reported that the deadline for elections officials to receive vote-by-mail ballots returned by mail for the March 5 Presidential Primary Election is March 12 if it is postmarked on or before Election Day and delivered to the elections office by the US Postal Service or a private mail delivery company no later than seven days after Election Day.
Elections officials said there are many checks and balances when certifying the election results. The process of certifying election results, also known as the official canvass, is mandated by state law to make sure the public can have confidence in the integrity of the final results. Staff members are working very diligently on completing all tasks required to certify the election.
“Vote-by-mail” ballots must be examined by staff to see if the signature compares with the voter’s signature on file.
After the vote-by-mail voter’s information has been entered and proofed, the vote-by-mail envelopes have to be sorted by voting precinct. Staff must verify the number of vote-by-mail processed by the voting precinct before the envelopes can be opened. Once staff balances, the envelopes can be opened.
“Polls provisional ballots” are cast at the polling places on Election Day. Some of the reasons a voter is issued a Provisional Ballot:
• The voter’s name is listed on the active voter roster list as a vote-by-mail voter and the voter is unable to surrender his/her vote-by-mail ballot in order to be issued a polls ballot.
• The voter’s name is not printed in the roster-index, has moved and did not re-register to vote at his/her new residence address.
• A voter is voting in the wrong voting precinct and not his/her assigned voting precinct.
• A first time voter who is required to provide ID, but is unable to do so.
• The voter’s eligibility to vote cannot be determined by the poll worker.
“Conditional voter ballots” issued to a person who missed the regular voter registration deadline of Feb. 20 but they still have the option to vote in an election by conditionally registering to vote and casting a conditional ballot (same day voter registration).
Voters that were allowed to sign the roster-index and issued a ballot at their assigned polling place, their voted ballot was counted at the Registrar of Voters office, on Election Night.
In addition, all of the roster-Indexes must also be examined for errors or omissions. Staff checks the ballot statement including the number of returned voted ballots against the number of voters who signed the roster-index.
Provisional and conditional voter signatures also need to match the number of voter provisional and conditional ballots. Once this is done, staff must enter voter history from each of the roster-indexes and record it into the voting system as voter history.
For more information call the Registrar of Voters Office at 707-263-2372 or toll-free at 888-235-6730.
- Details
- Written by: Lake County News reports
The event will be held Thursday, March 14, from noon to 1 p.m. in room 715.
This panel discussion will bring together a dynamic group of women leaders in education to discuss their experiences, challenges and triumphs in education.
New Woodland Community College President Dr. Lizette Navarette will lead the panel, which will include Lake County Campus interim Dean Patricia Barba, Konocti Unified School District Superintendent Dr. Becky Salato, Lake County mental health practitioner and Konocti Unified Board Member Zabdy Neria and Angela Cuellar, Lake County Office of Education QRIS director and early childhood education adjunct instructor for Woodland and Mendocino colleges.
Lunch will be available for purchase at Aromas Café from 11:30 a.m. to 1 p.m.
For more information contact Mary Wilson at 707-995-7913 or
- Details
- Written by: Elizabeth Larson
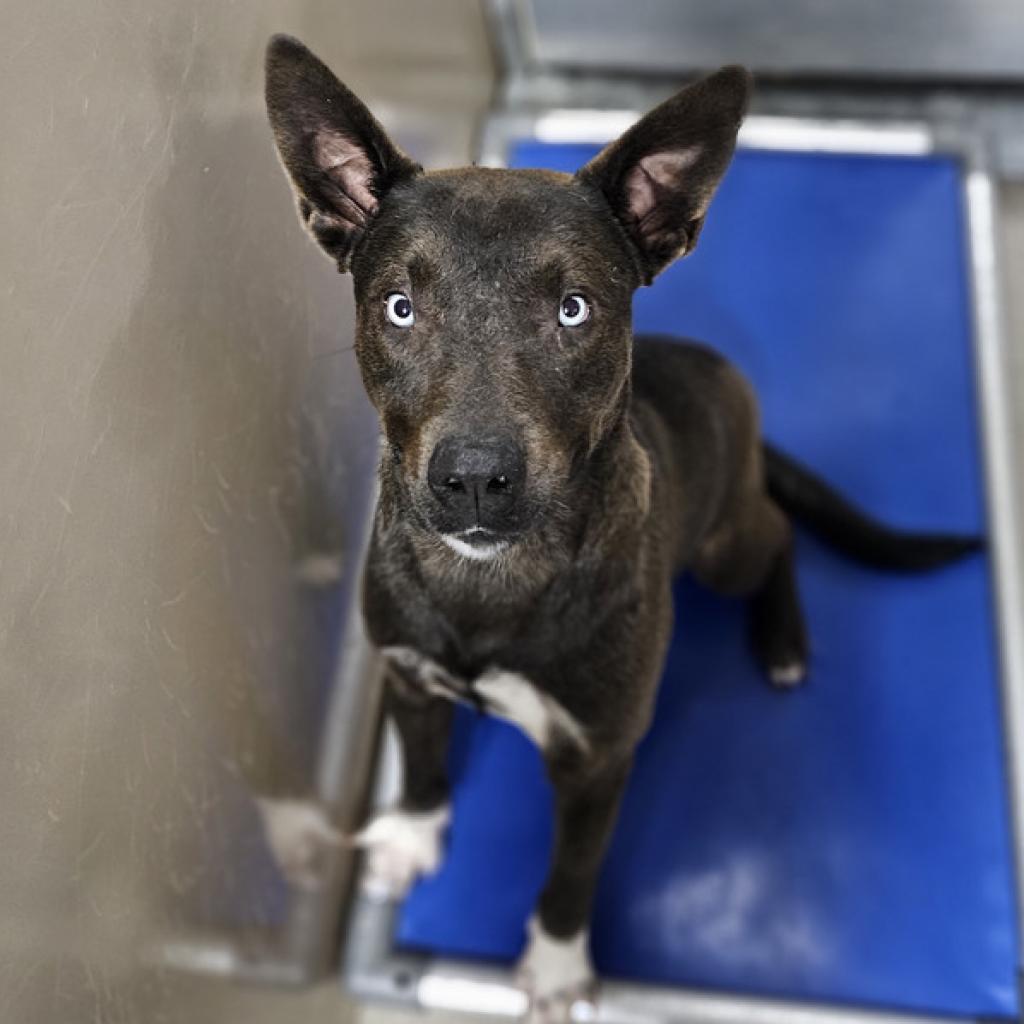
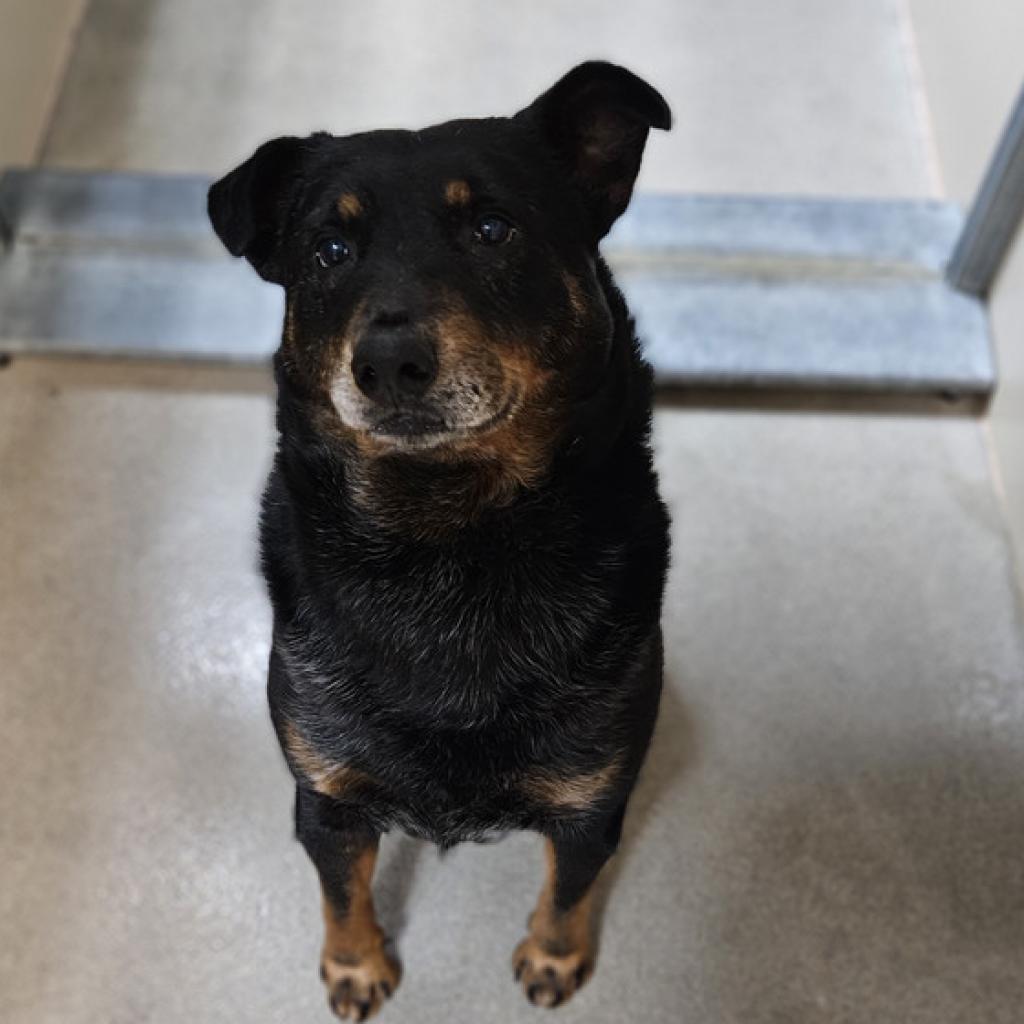
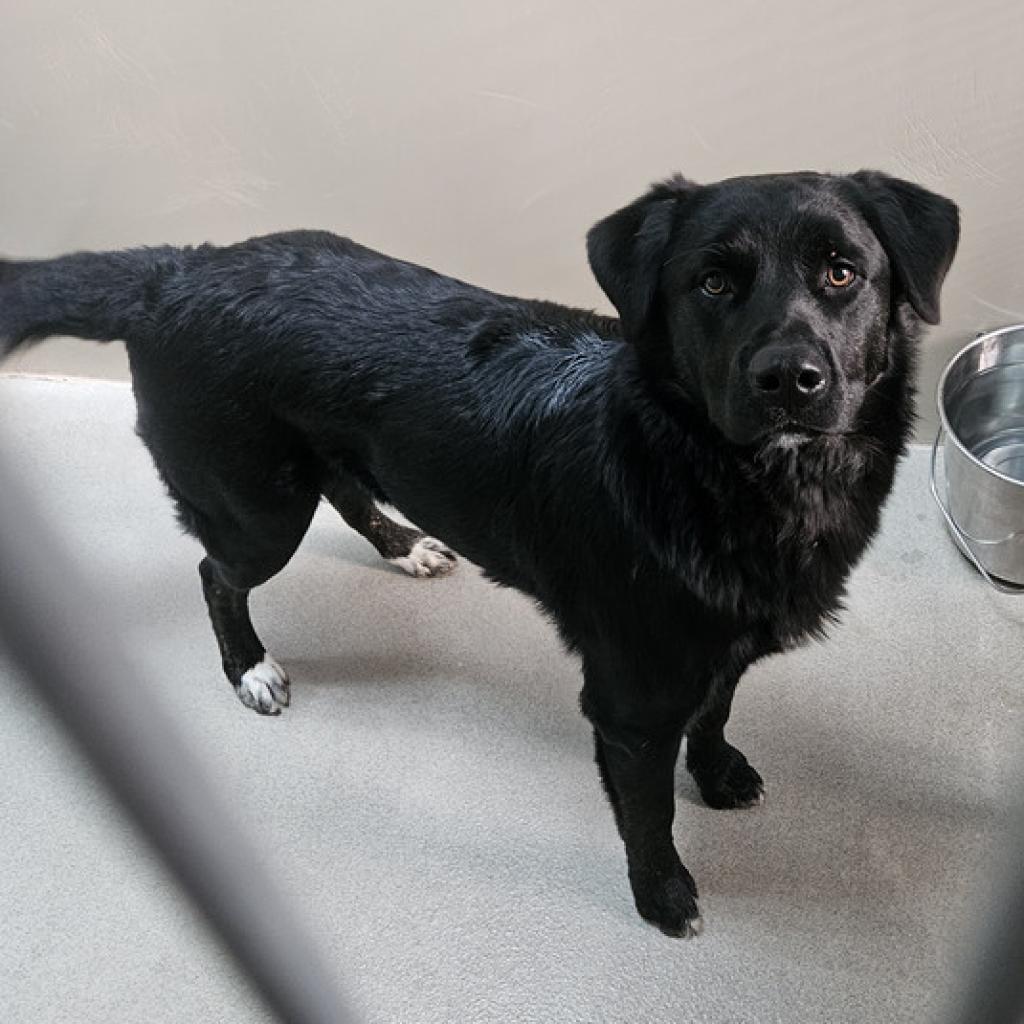
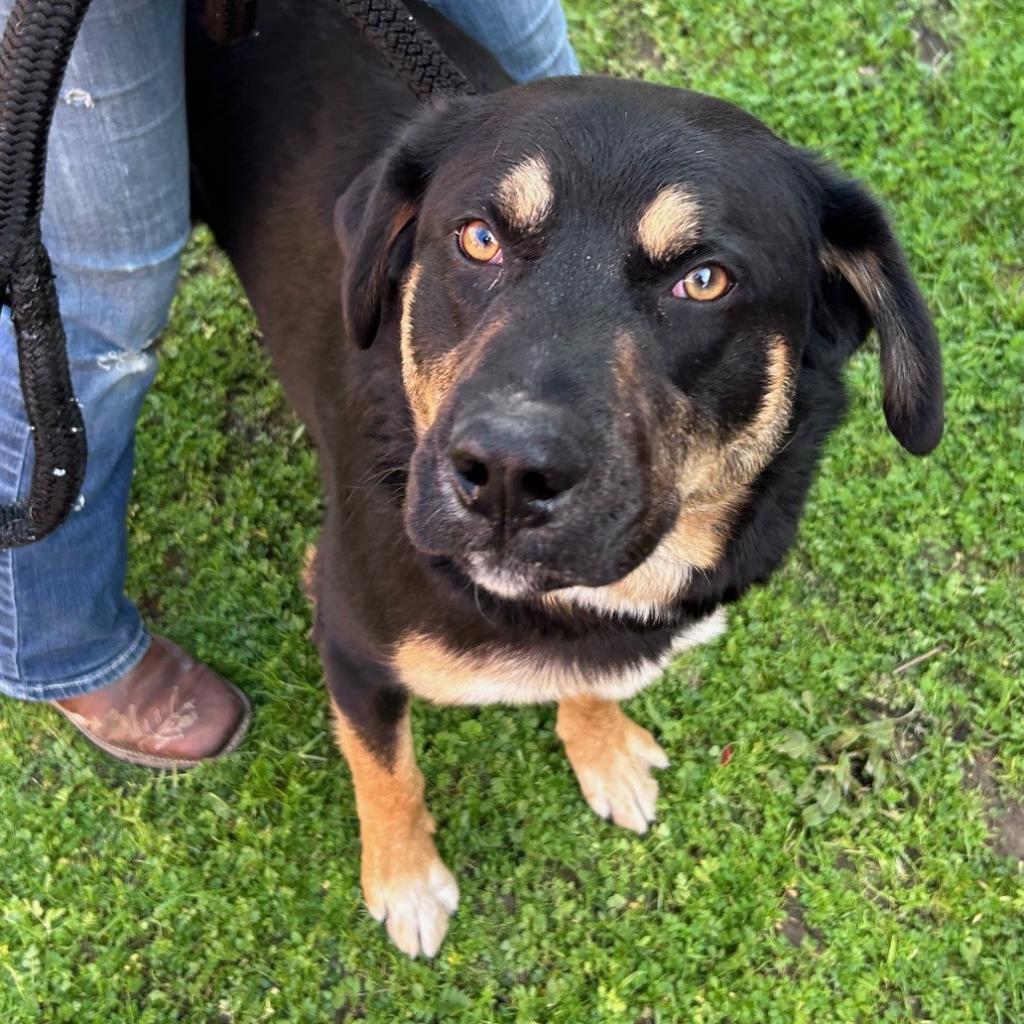
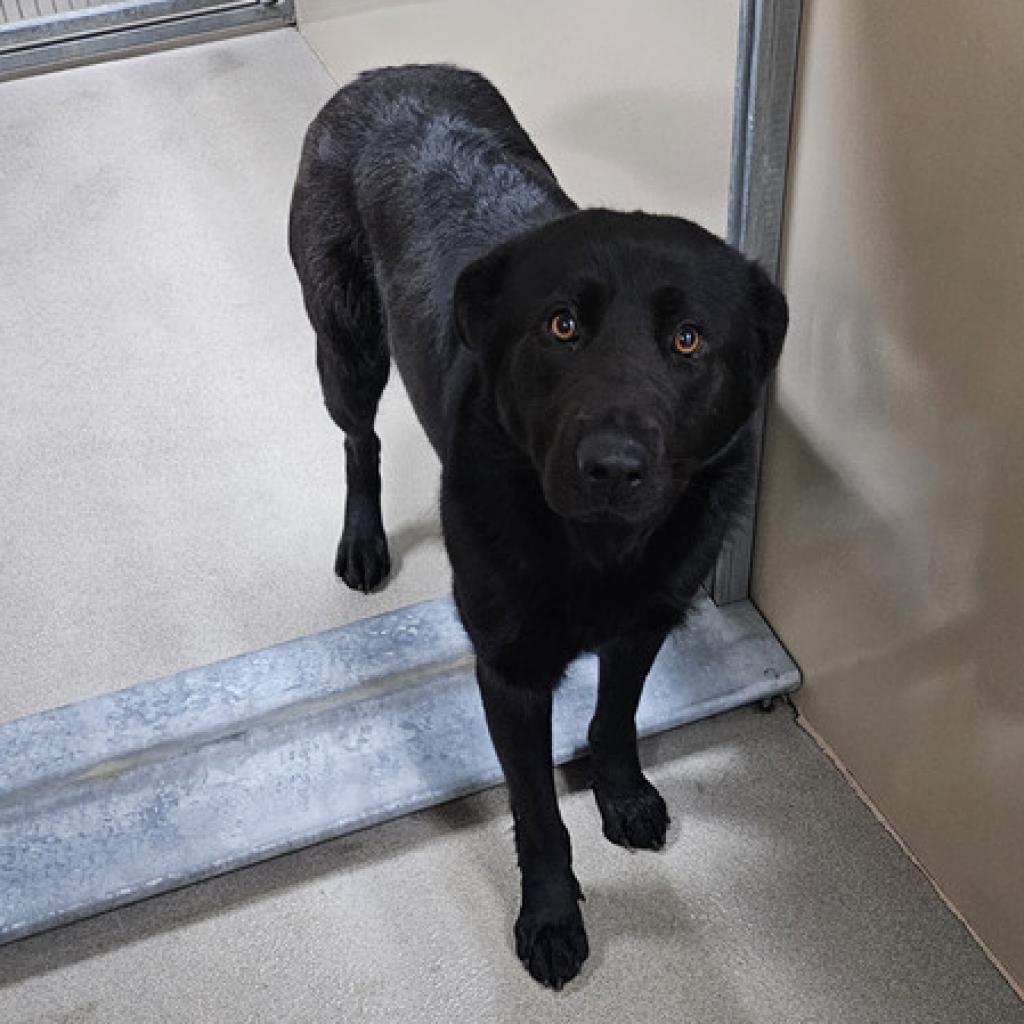
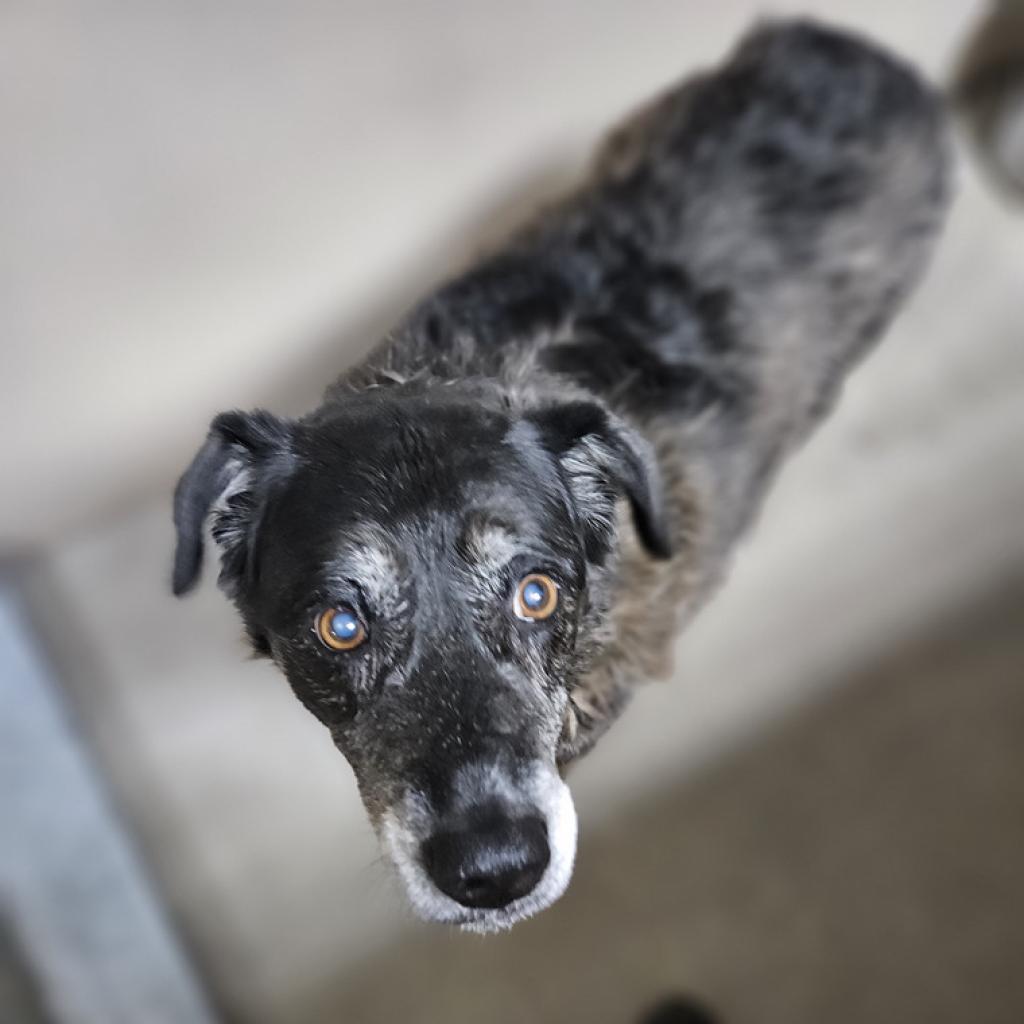
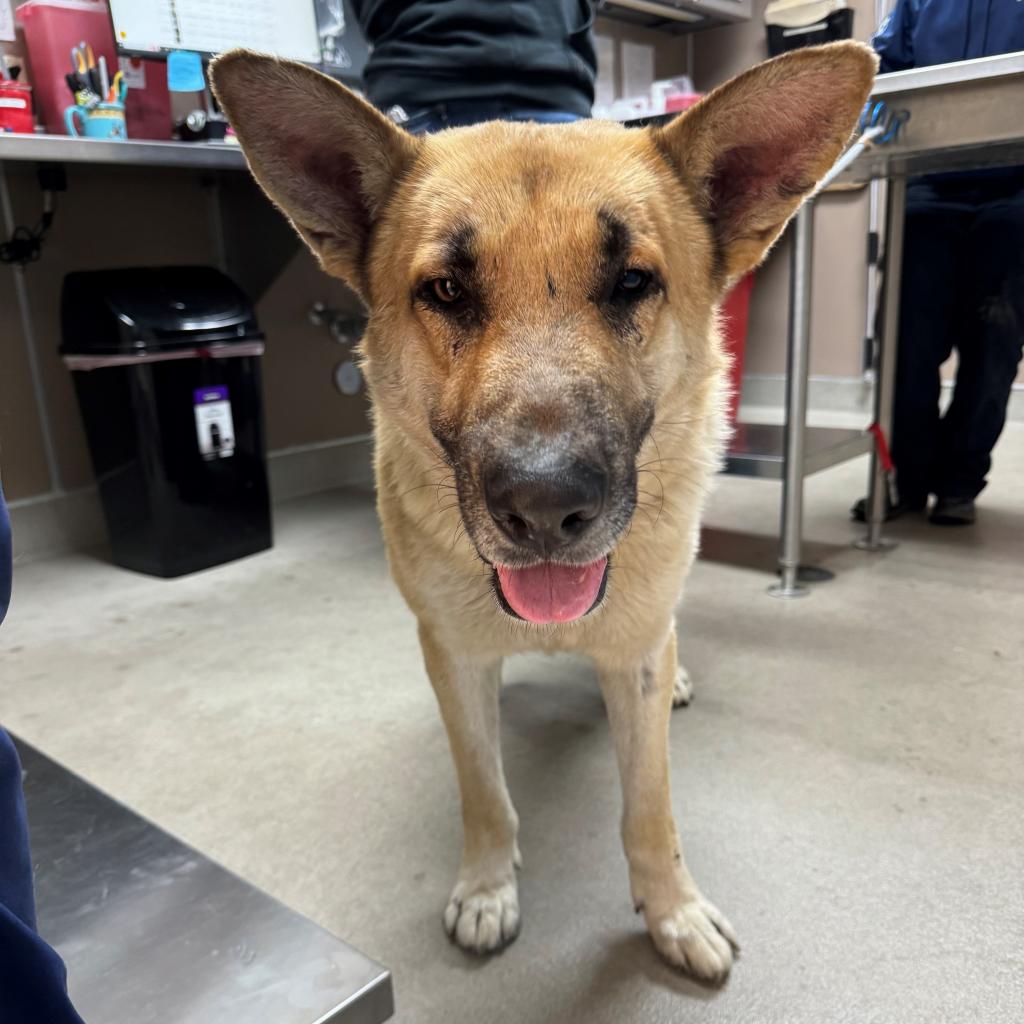
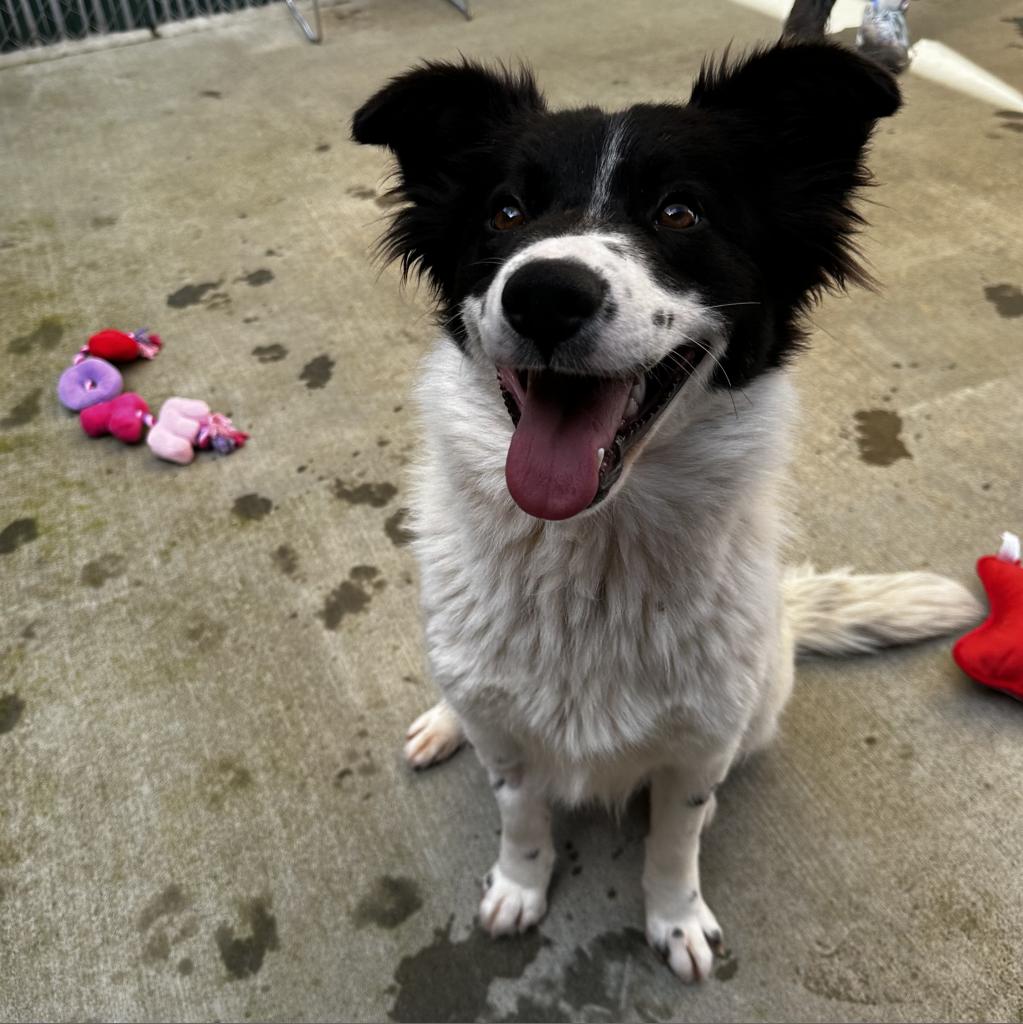
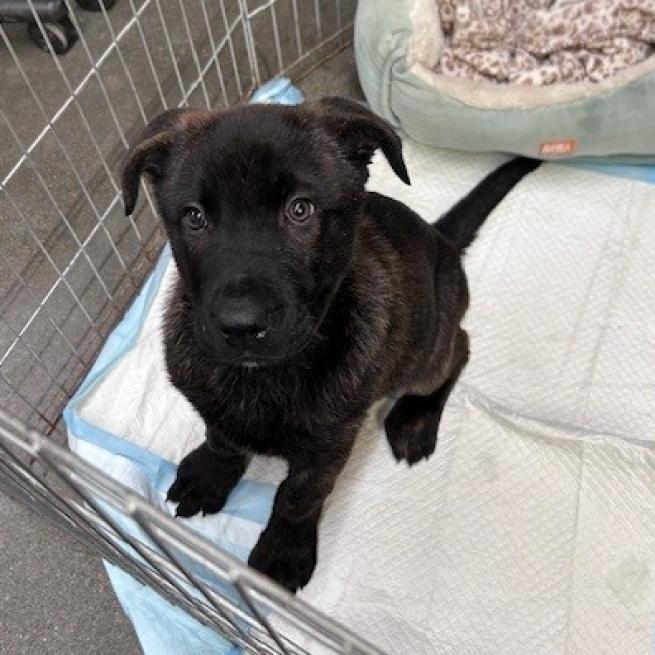
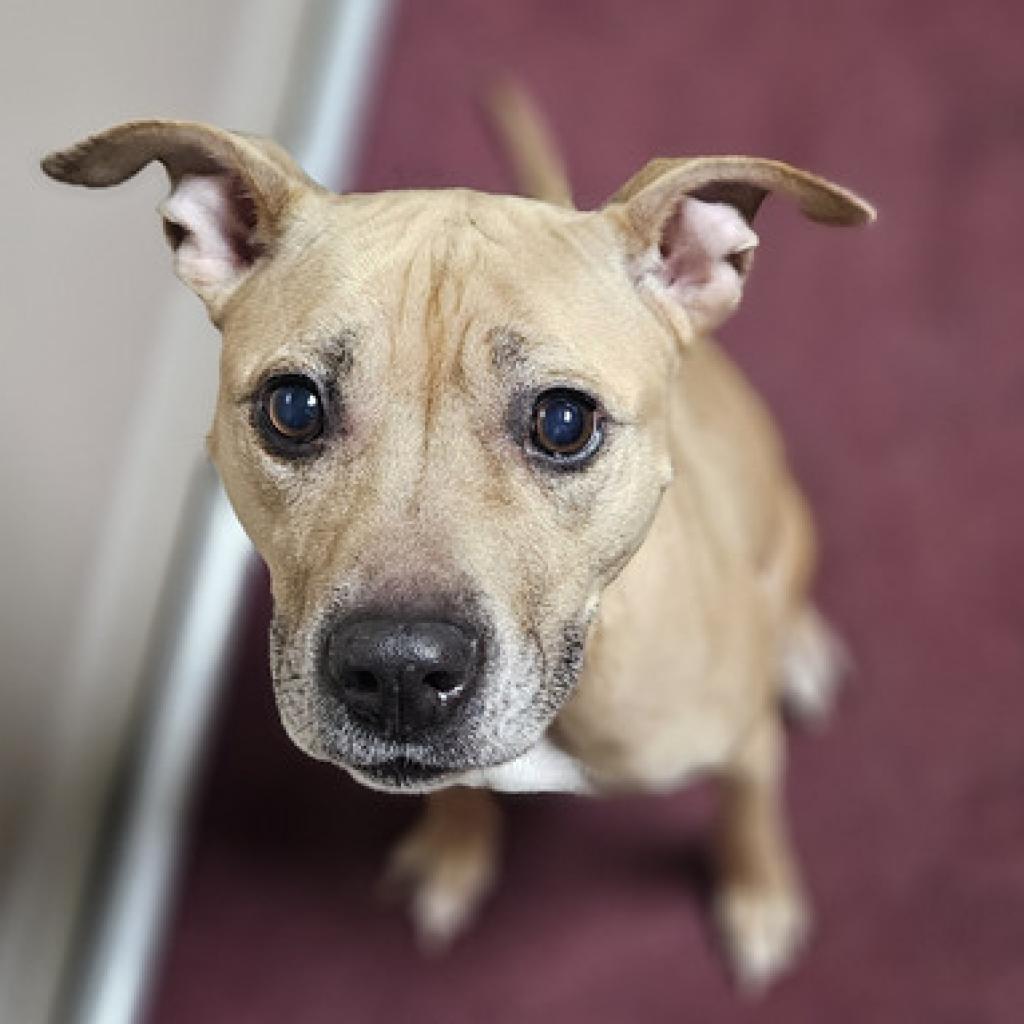
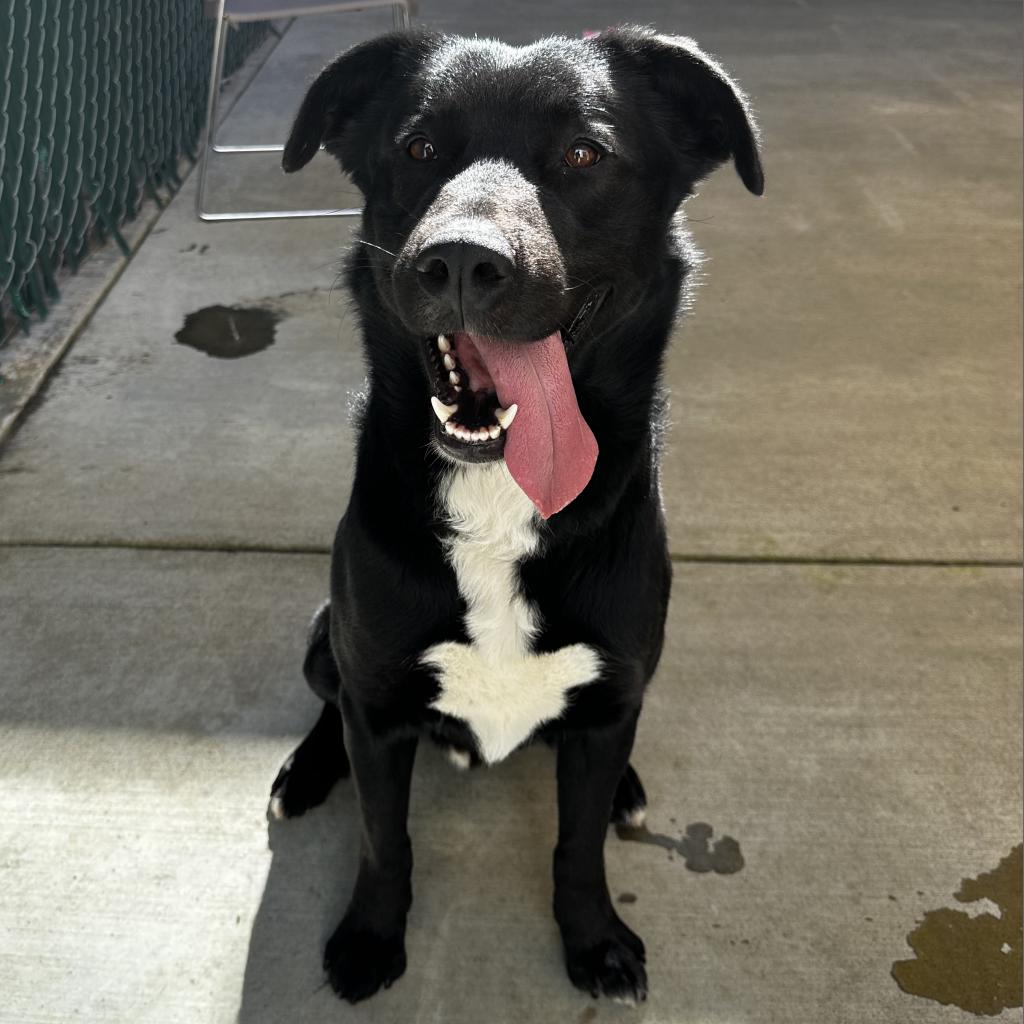
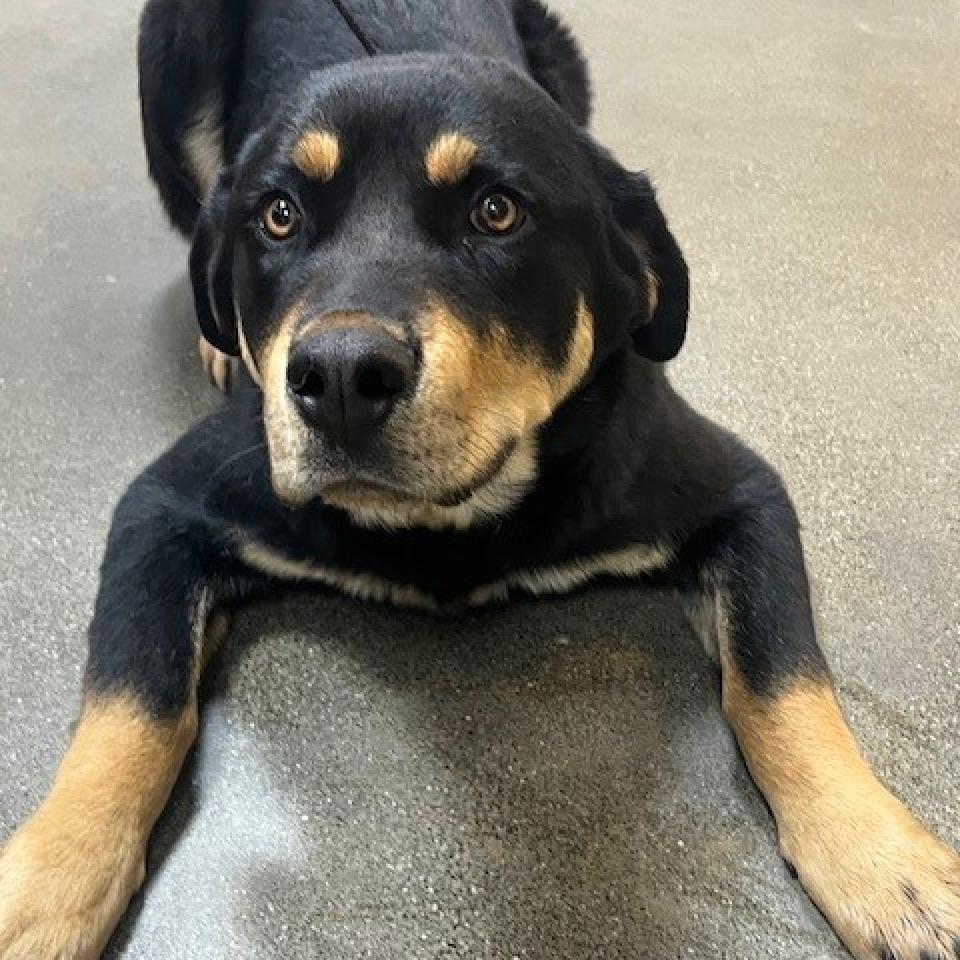
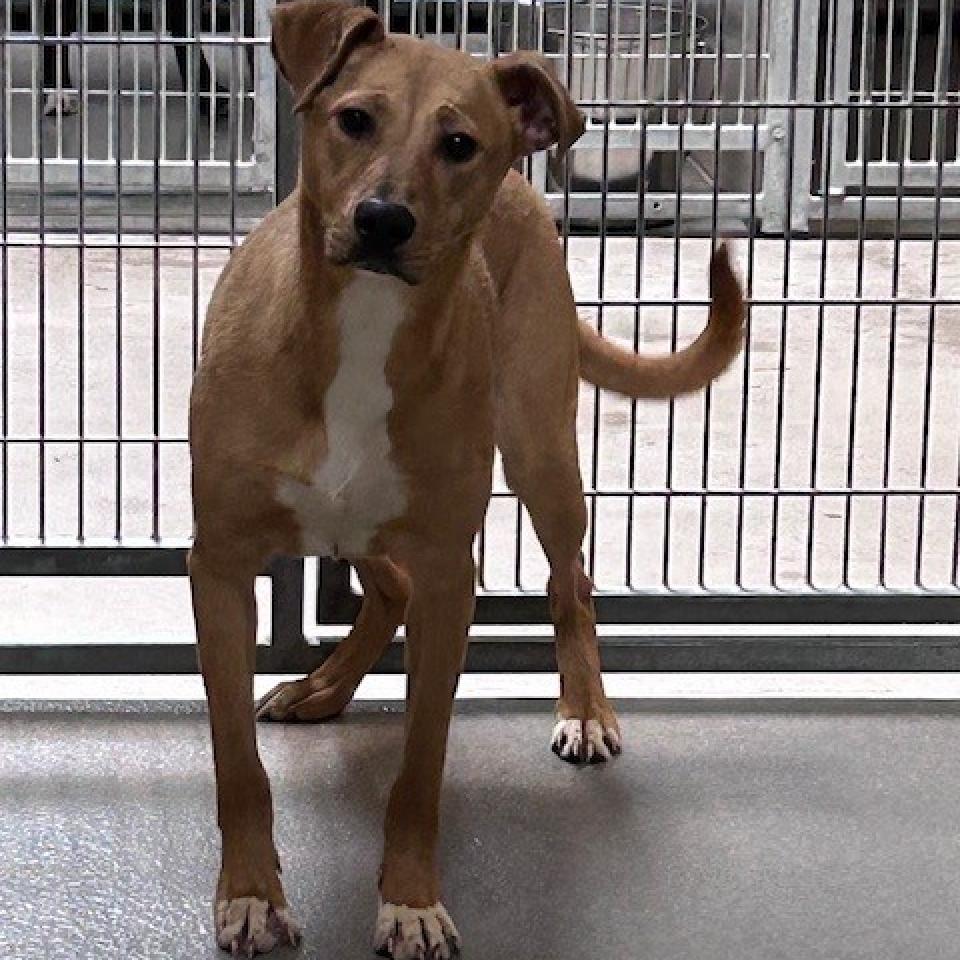
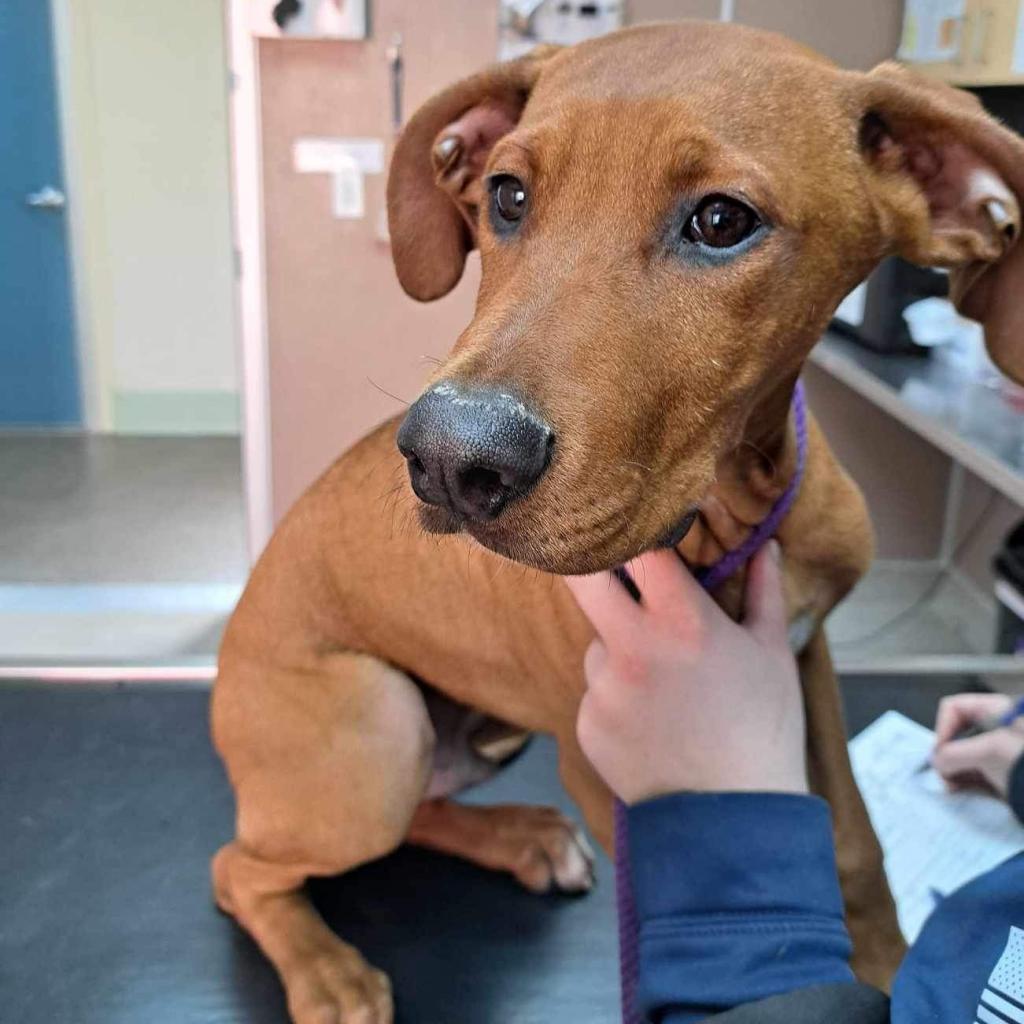
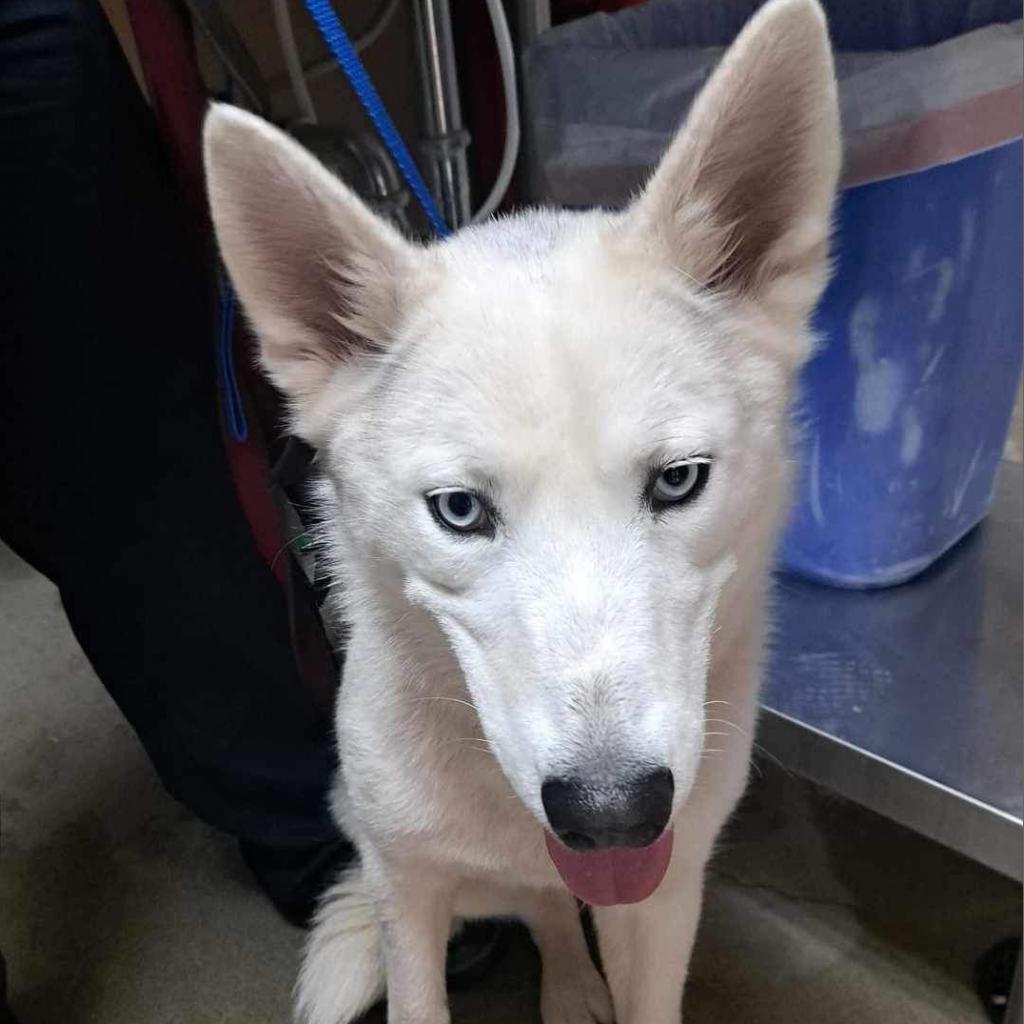
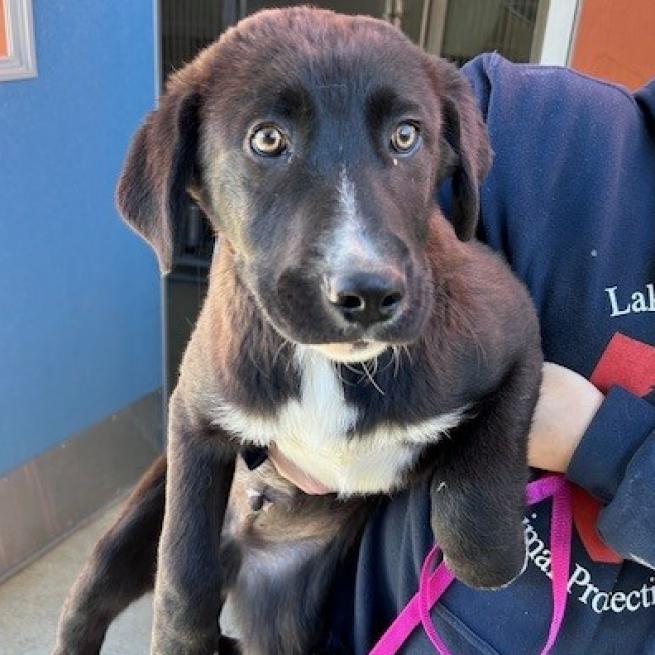
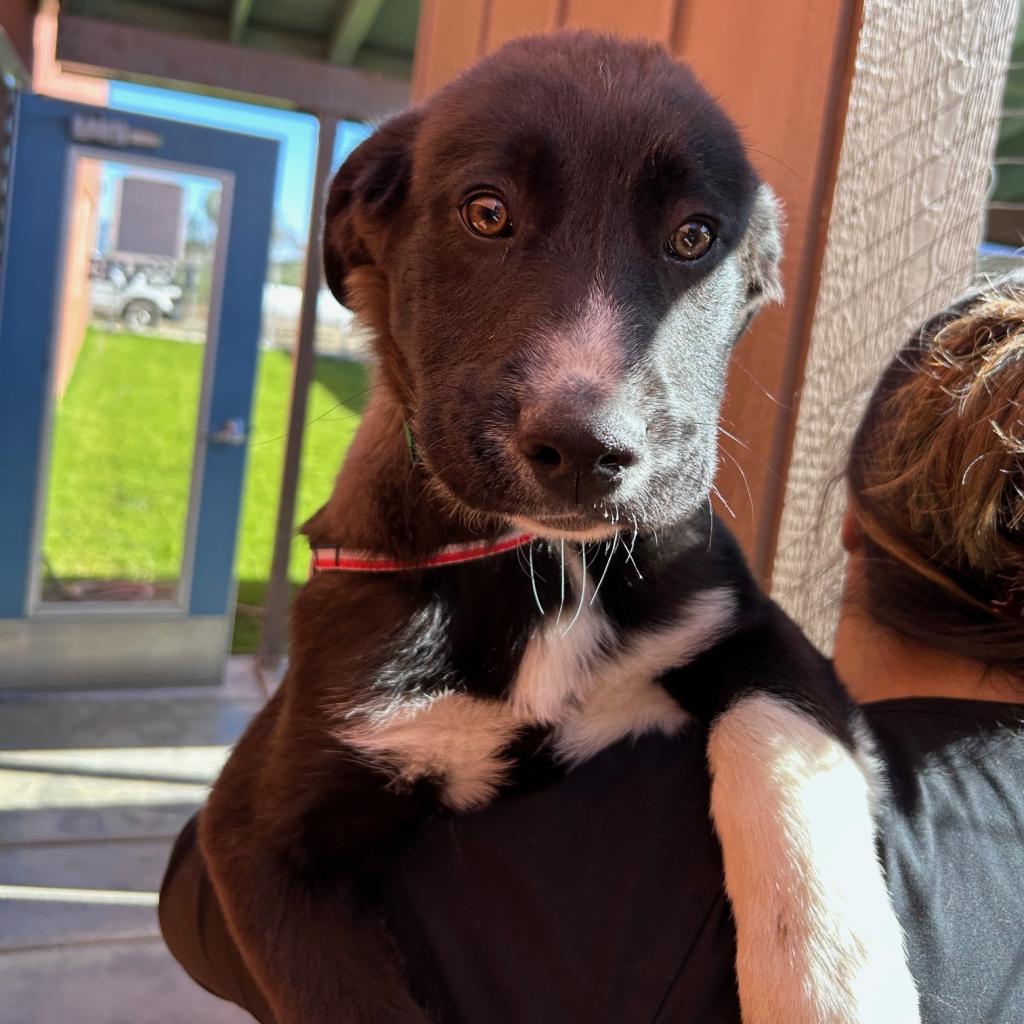
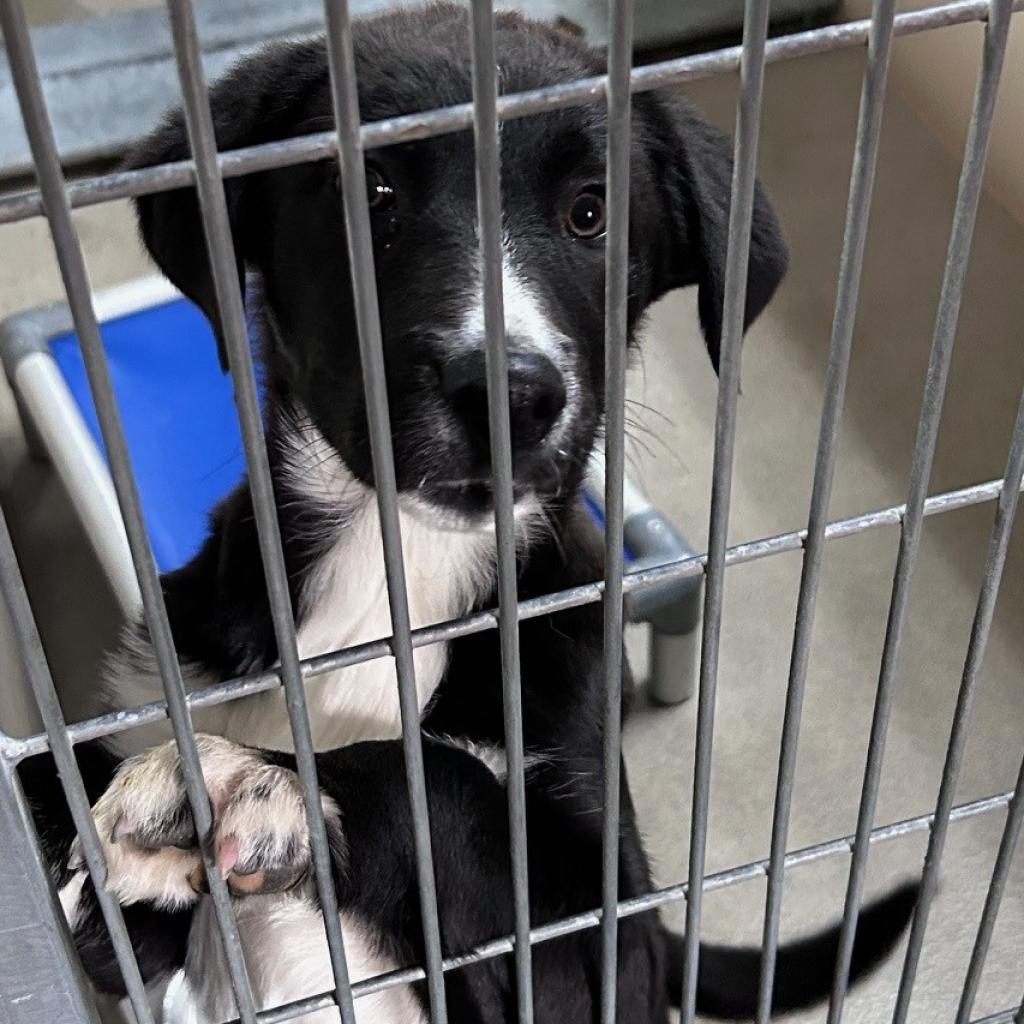
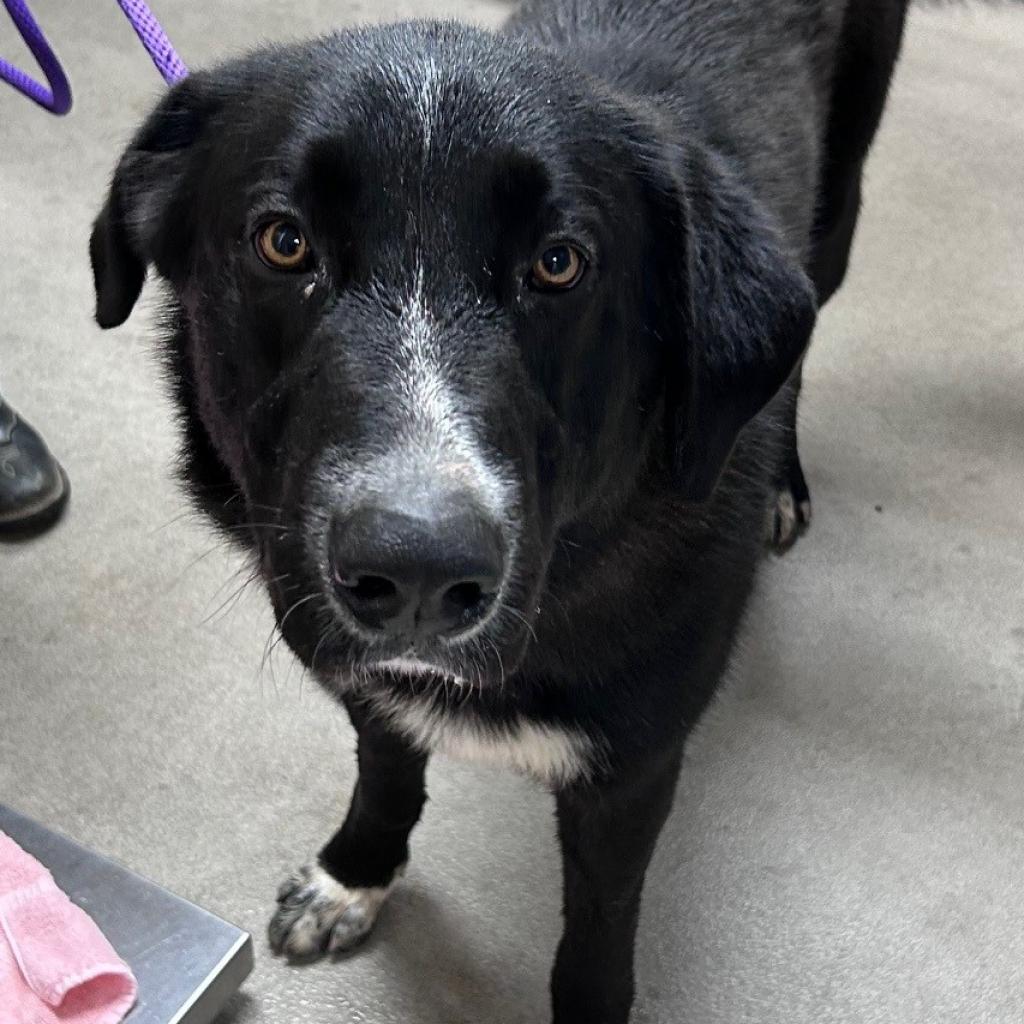
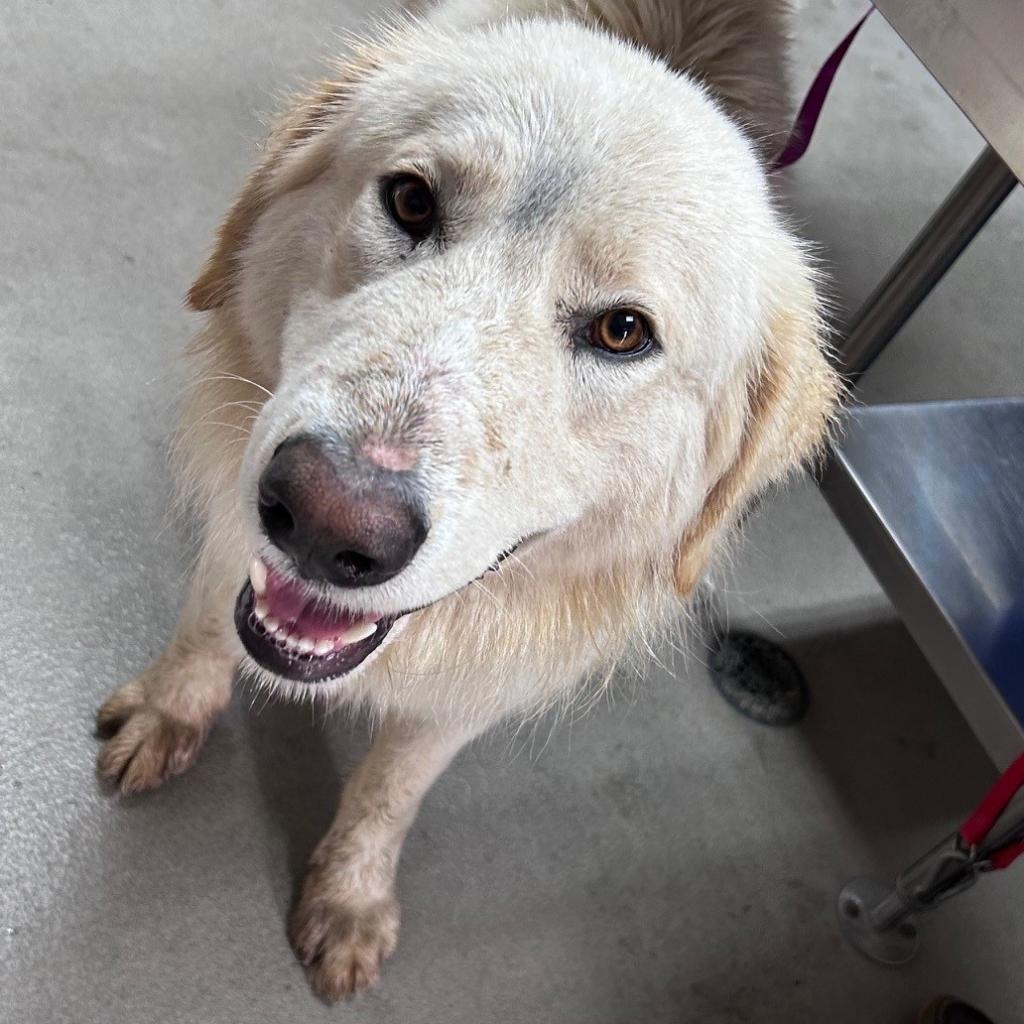
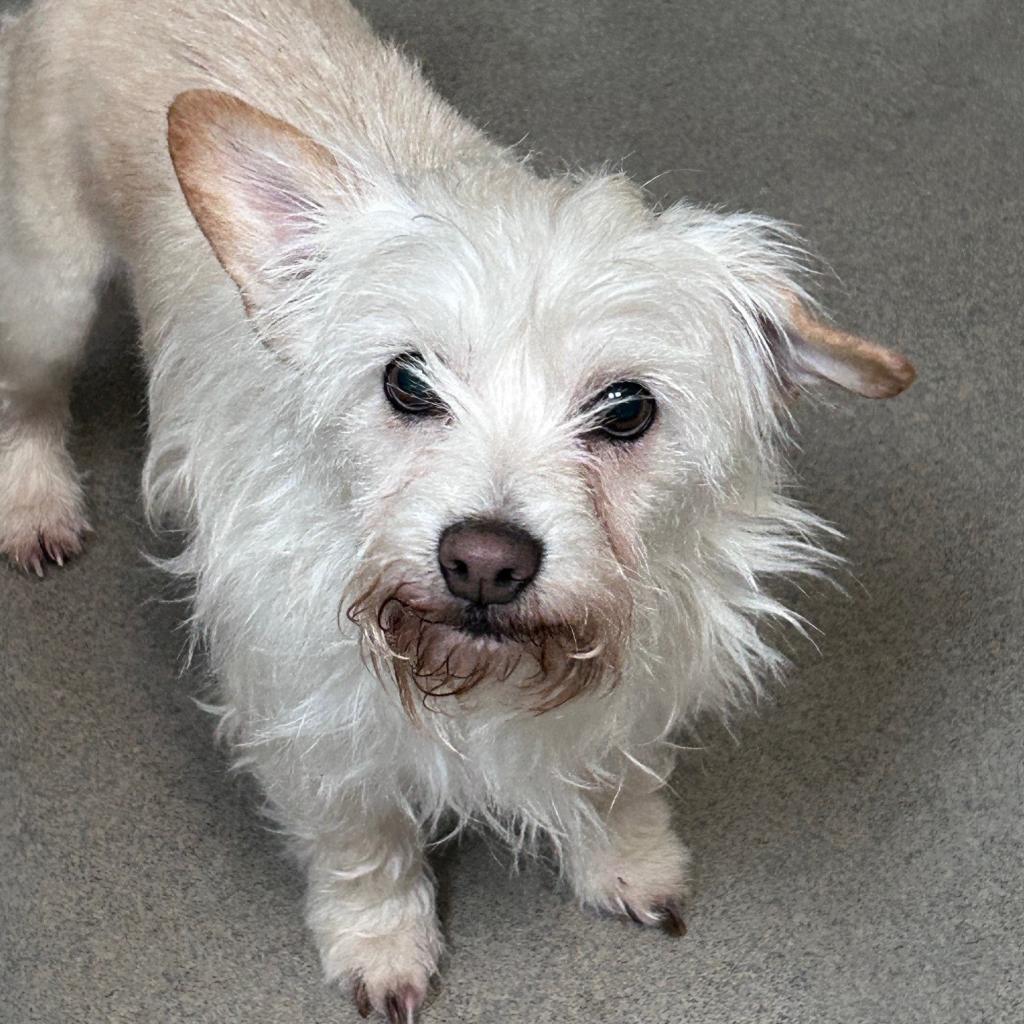
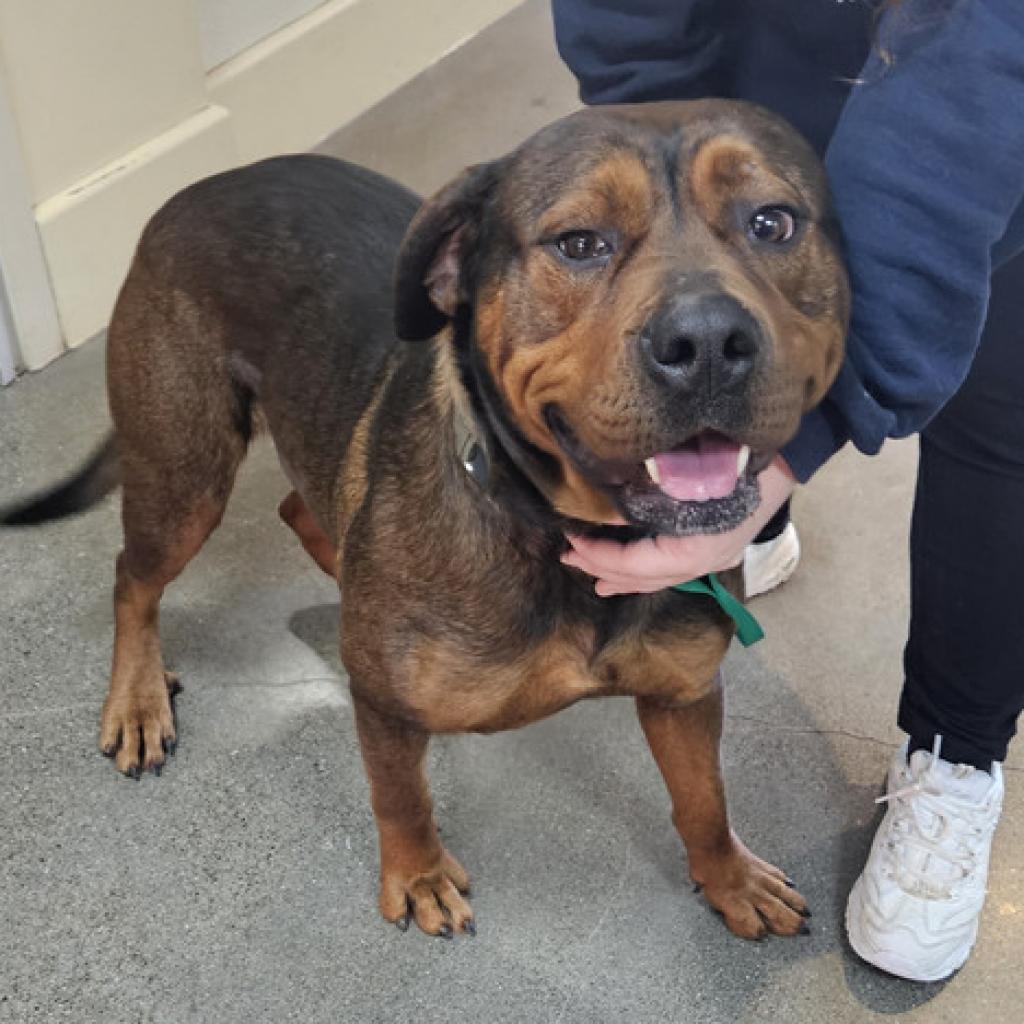
Dogs available for adoption this week include mixes of Australian shepherd, border collie, boxer, German shepherd, hound, husky Labrador retriever, pit bull, Queensland heeler, Rottweiler, shepherd and terrier.
Dogs that are adopted from Lake County Animal Care and Control are either neutered or spayed, microchipped and, if old enough, given a rabies shot and county license before being released to their new owner. License fees do not apply to residents of the cities of Lakeport or Clearlake.
Those dogs and the others shown on this page at the Lake County Animal Care and Control shelter have been cleared for adoption.
Call Lake County Animal Care and Control at 707-263-0278 or visit the shelter online for information on visiting or adopting.
The shelter is located at 4949 Helbush in Lakeport.
Email Elizabeth Larson at
Kennel#25
Kennel#18
Kennel#6(Mac)
Kennel#7(Cheeze)
Kennel#34
Kennel#13
Kennel#26
Kennel#9
C#39
Kennel#11

Kennel#4
Kennel#33
Kennel#10
Kennel#8
Kennel#19
Kennel#14(Nala)
Kennel#32a (blue collar)
Kennel#32b (green collar)
Kennel#29
Kennel#27(Dex)
Kennel#21(Palomo)
C#96(Bonnie)
Kennel#5
- Details
- Written by: Angela DePalma-Dow
Dear Lady of the Lake,
Is there an easy and quick way to learn about the stream and lake levels in Clear Lake? I was also wondering what your expert guess/prediction would be on the Rumsey level of Clearlake after this current storm passes through?
Thank you,
- Lake Level Larry
Hello Larry,
Great question and perfect for this time of year! We have been getting quite a bit of rain and that means the creeks and streams will have high flows of water, which do flow to Clear Lake. Every year I get lots of questions about how the stream and lake levels are measured and where that information can be found.
Lake and stream level data is collected from permanent gauge stations. Usually these gauges are installed, calibrated, and quality controlled by state or federal agencies. The majority of gauges situated around Lake County are managed by the United States Geological Survey, or USGS, and California Department of Water Resources, or CDWR.
Gauge technology has come such a long way! The internet has helped. Most government funded gauges are connected to a website where real-time or updated measurement data can be viewed and downloaded.
Gage / Gauge language
Before you start to write me that email about my use of gage vs. gauge, please read the following disclaimer where I directly address the gage / gauge spelling issue.
While I have received many, many emails providing me the right gage/gauge to use, here are some gauge facts. The vernacular use of “gage” and “gauge” can be used interchangeably and both can be used as a verb or a noun. Technically, the word “gage” is a different word altogether (it means to throw down a challenge, like a knight proposing combat). But while knighthood battles are mostly extinct, the word “gage” is still maintained in the English language.
The USGS has a historical affinity for the use of “gauge”, but more recently uses gage (for any of the USGS plot displays, the word “gage” is provided). According to Merriam-Webster Dictionary, considering global use, “gauge” is the preferred variant of this word and is more commonly used than “gage”. According to ESL.com, the word “gage” is becoming obsolete.
If you ask the Lady of the Lake, life is too short to gauge your happiness by the amount and type of gages being counted, but don’t mind me and pick the gauge/gage that is right for you!
Now, back to the vocabulary.
Below we will cover some stream gage terminology that will be useful when accessing and viewing stream gage data websites. Like most things in science, there are specific terms that are used to distinguish units of measurement so that there is no confusion when communicating information.
Stream stage = height of the water from the bottom of the gage located within the stream, which may or may not reflect the deepest part of the stream. Stream bottoms and sides can change in depth as sediments move, shift, get pushed around or pile up.
However, a permanent gage station will always report the stream gauge from a stationary fixed point so that the data collected over time is consistent and comparable and not reflective of changing stream bottom. Usually stream gauge locations are selected to be where the least amount of change in a stream will occur, but variation is always common in natural systems. Most technically advanced gauges these days are calibrated with elevation considered into the transducer that measures the water depth.
Stream flow or discharge = this is velocity or speed of the water and the amount of water flowing past the point where the measurement is being collected, generally at the gage station. For example, the discharge of Middle Creek during any given storm could be 1,400 cubic feet per second, or CFS or ft³/s. So in one second, about 1,400 cubic feet of water passed the gauge on Middle Creek. That is quite a bit of water for our regional creeks, but to put it in perspective, The Mississippi River has an average discharge of 593,000 CFS!!
Forecast = a statement of prediction. For the stream gauge, the river forecast visually shows predicted conditions of stream stage, flow, discharge, and sometimes even precipitation based on climate data and expectations for upcoming weather.
Guidance = is the modeled predicted conditions of stream stage and flow. Usually this is based on years of previous data and models, in conjunction with forecast information. Guidance is more of a “sure thing” than forecasted data, but they are both expectations of future conditions and are subject to change.
Current stream and river stage and flow data
There are lots of resources available online for anyone to access real-time stream and river data. I will share two of my favorites with you. I suggest you take some time and explore these resources to see all they have to offer, which can be quite a bit of information that can be useful in different ways.
My personal favorite site is the California Nevada River Forecast Center. The California Nevada River Forecast Center, or CNRFC, is a field office of the National Weather Service located in Sacramento, California. The CNRFC is co-located with the Sacramento NWS Forecast Office, CDWR, and United States Bureau of Reclamation. The NWS is an agency of the National Oceanic Atmospheric and Administration, or NOAA, under the United States Department of Commerce.
I can not emphasize enough how much I love this website; I have all of our county and Lake gage pages from this website bookmarked on my phone browser and my work and home computers. I have used this website for many projects from monitoring post-fire debris flows, first flush stormwater monitoring, and flood preparation and flood watch.
It is also very user friendly and displays a lot of very useful information in only one or two scrolls on a computer or smart phone. The graphical plot of past, current, forecast, and guidance data is easy to view and easy to understand.
If you are new to this website, and need some guidance, you can refer to this video I made, from a previous column, that walks through the website to get to the data display and stream plots for local data.
In this video tutorial, Lady of the Lake demonstrates how to access local stream gauge information on both the California Nevada River Forecast Network and California Data Exchange Center Websites.
Water Resource managers use stream stage data regularly. Safe operation of diversion structures, weirs, or dams are dependent on the opening or closing of structures and gates at certain thresholds of stream stage or flow. Predictive gage information is valuable because it allows managers to monitor multiple stream gage sites at once without having to sit on site in potentially hazardous conditions for hours waiting for the threshold to hit.
Prediction data is also wonderful in that it allows the public to use the same tools that are available to researchers and agencies - making it easy for everyone to be best prepared when conditions change are of a concerning nature.
Additionally, during spring when Clear Lake Hitch are starting their spawning migrations upstream, the flow data in streams around Clear Lake is being used to help identify preferred conditions for hitch and reproduction success. This information is playing a huge role in the management and recovery of this important and state-threatened fish species.
If you live adjacent to a stream or river and are concerned about flooding, I would look into exploring if a stream gauge is located somewhere on that stream system. You don’t need to be near a stream gauge for the data to provide value, as long as one is located somewhere along the stream.
Some gage stations even have automatic alerts you can set up on your smartphone that will automatically send a text message should a specific river or stream reach a certain stage or flow. A good place to learn about such a tool is USGS WaterAlert.
The next resource is California Data Exchange Center, or CDEC. This website is managed by CDWR and while it does have some prediction power, the majority of gage information here is real-time and archival. However, it’s pretty easy to use and has a large network of gauges and data that expands across all of California.
One thing about the CDEC is the data is focused on river information. The tabs at the top of the home page provide a lot of the type of data and tools available, and makes it easy to search for what you might need. Historic water data is also easily available on CDEC, making it easy to conduct a study on your local stream or river.
One thing to be aware of with CDEC is that the website can get pretty busy and bogged down during popular use times. If there is a heavy storm event and people and agencies are looking for river data and flood conditions, this website might get really slow and pages might not load as quickly, so be patient.
Also, CDEC usually doesn't provide forecast or guidance data on their plots, that is something that CNRFC specializes in with their partnership with USGS.
Measuring lake levels
Clear Lake level is determined in a very unique way, different from all other lakes and reservoirs. Clear Lake uses the Rumsey gauge to measure lake levels. I described this in my column, “Learning about Lake Levels” from Oct. 17, 2021 and again in “Revisiting Lake Levels and Lake Hazards” from March 2023.
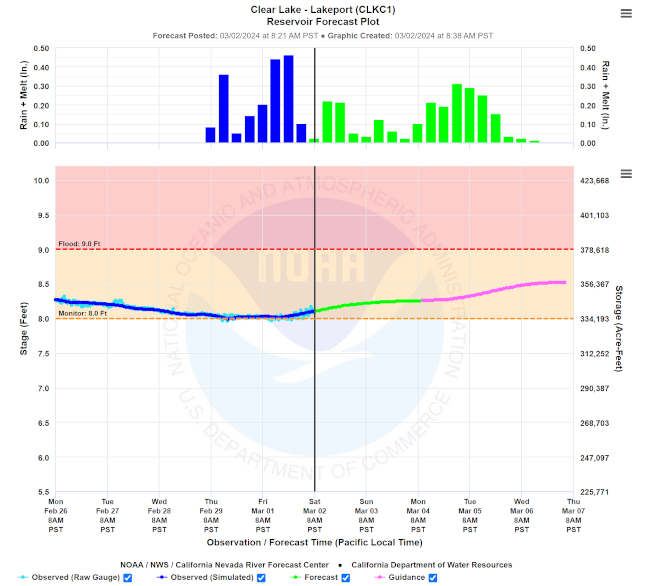
Daily lake level data is measured from an in-lake gauge (#11450000, CNRFC gage CLKC1) operated and maintained by the USGS and housed at the lakeside Lake County Vector Control District Offices and be accessed online here.
Last year, during the wet season after we were coming out of a 3-year drought, I wrote a column about predicting lake level rise. With the lake starting at negative Rumsey, it was hard to predict exactly how much rain was needed to get to a full lake.
Luckily, CNRFC has added lake level forecasts into their models and displays this information on their lake level plot. The period of the line in green is reflective of the forecast based on previous 6-day trends of the precipitation and lake level rise. The portion in pink is the guidance, or estimated lake level.
Larry, here is where you can answer your question about the expected lake levels. Using the CNRFC plotted forecast information, the lake level is expected to rise to 8.5 ft Rumsey by the end of this current storm event that ends Wednesday.
In general, once the lake is full at 7.56 feet Rumsey, and the watershed is saturated from several storm events, the rise of the lake corresponds to about 1 inch rise for every 4 to 5 inches of rain. So, if we got 5 inches of rain, we would expect to see about 1 feet of lake level increase.
Logistically, the lake is rising from the rain itself (collecting in the lake) and the collection of runoff from the landscape and tributaries flowing into the lake contributes to the lake level increase. According to the Lake County Water Resources Department Historical Levels of Clear Lake High and Low there is 10% chance of getting to minor flood stage, and 1% chance of the lake getting to major flood stage in any given year.
Also, the Lake County Water Resources Department monitors the daily lake level and can provide that to you by phone at 707-263-2344, if you do not have access to the website and they have all the links for all the regional gages, located on their website at the “Hydrologic Information” Tab located here.
Clear Lake water level lowers slowly
It's important to understand that if the lake reaches a critical flood stage, there is nothing that can be done to magically make the water recede “faster” because the water has to work its way out through the Grigsby Riffle and Cache Creek dam. Therefore, it’s up to the residents who live in low lying areas to be prepared in the event of high water and resulting flood conditions.
The reason why water leaves the lake so slowly is because there is only one outflow compared to the many inflows. The single outflow of the lake is located in the Lower Arm past Anderson Marsh State Park. The outflow becomes constrained within a natural rock and gravel formation called the Grigsby Riffle located in Cache Creek. The water then flows through Lower Lake and to the Cache Creek Dam managed by Yolo County Flood Control and Water Conservation District.
To better understand how lake levels and flows interact over the Grigsby Riffle and into Cache Creek, you have to understand how Clear Lake is different from Reservoirs. The Water Resources Department recently created a profile infographic that depicts the lake basins and how water flows into the lake and out through the Cache Creek dam during different water scenarios and how it’s connected to Cache Creek.
The infographic can be accessed here.
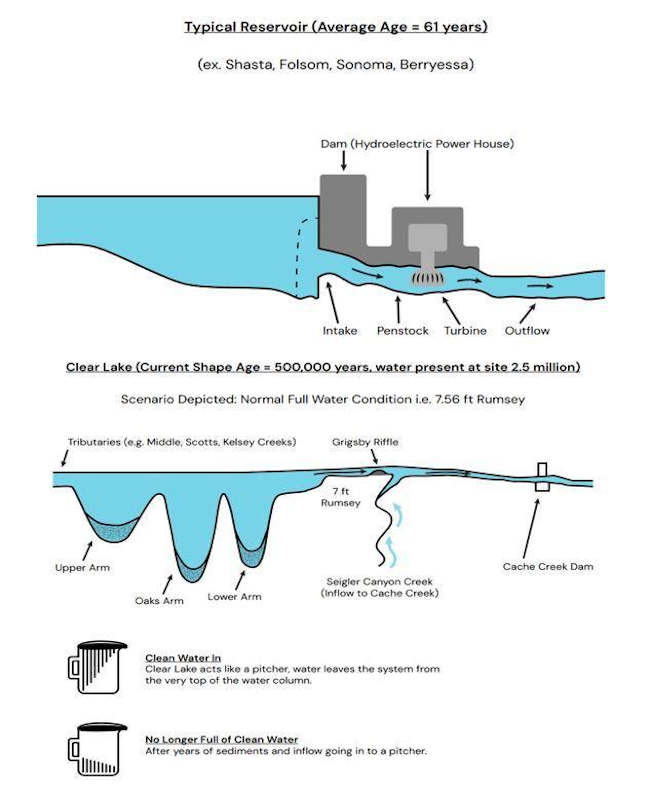
Whether the lake is baseline full at 7.56 Rumsey or in flood stage, there is a maximum amount of water that can flow over the Grigsby Riffle and into Cache Creek. Opening the dam gates does keep that water flow in Cache Creek consistent and moving, but there is a maximum flow of water that can move over the Grigsby Riffle which is about a 4,700 CFS maximum even when the lake is at peak flood (11 ft Rumsey).
When you live on or around Clear Lake, one of the most important things to understand about flow leaving Clear Lake is that the Cache Creek Dam does not control the amount of water that can flow from the lake and the dam does not cause flooding around the lake.
The Cache Creek dam is actually built for a bigger stream system than what Clear Lake can provide down to Cache Creek. Cache Creek Dam is designed to release water at 21,000 cubic feet per second (cfs). However, Clear Lake outflow, combined with Siegler Creek outflows, deliver less than 4,700 cfs even when Clear Lake is at 11 feet Rumsey.
To put these numbers into perspective, 2,700 cfs will fill a typical in-ground, backyard swimming pool in 1 second. These flows show that the Cache Creek dam can release almost 4.5 times as much water as can reach it even during severe flood events on Clear Lake.
More information on the history and flow testing to demonstrate the above scenario of the Cache Creek dam and flow from Clear Lake, you should visit the Lake County Water Resources Cache Creek Dam Flows webpage.
Flooding and other Emergency Information
It’s important to monitor the lake stage so you can be prepared for any flooding events due to high water in the Lake. First, be aware of current conditions, bookmark the lake gauges on your browser, on your computers and mobile phones. Check them often as storm events occur and after, as stream flow continues to increase lake water levels even after precipitation has stopped.
Check your flood zone area on the county of Lake Flood Plain map page.
In the meantime, the best course of action to prevent loss or damage to property due to flood, is to be prepared. The County of Lake Office of Emergency Services released a series of “Flood Prep” best practice tips for being prepared against disaster during flood season.
Road closures, due to flooded conditions, can be located on Zone Haven https://aware.zonehaven.com/search along with information for when they are reopened and safe for travel.
Additionally, The Lake County Department of Public Works - California facebook page usually posts the most recent list of locations to purchase sandbags and sand bag assembly materials.
For more information about shelters, or emergency services, contact the Lake County Office of Emergency Services or call them at 707-263-3450.
Sincerely,
Lady of the Lake
Angela De Palma-Dow is a limnologist (limnology = study of fresh inland waters) who lives and works in Lake County. Born in Northern California, she has a Master of Science from Michigan State University. She is a Certified Lake Manager from the North American Lake Management Society, or NALMS, and she is the current president/chair of the California chapter of the Society for Freshwater Science. She can be reached at