 How to resolve AdBlock issue?
News
- Details
- Written by: DERICK MOORE, GERSON VASQUEZ AND RYAN DOLAN
Irish heritage is strong in America: More than 31.5 million residents claim Irish ancestry, second only to German (43.0 million).
And when it comes to U.S. presidents, including current President Joe Biden, exactly half (23) trace some of their roots to Ireland.
Not surprisingly, the most Irish states are in New England and are geographically connected.
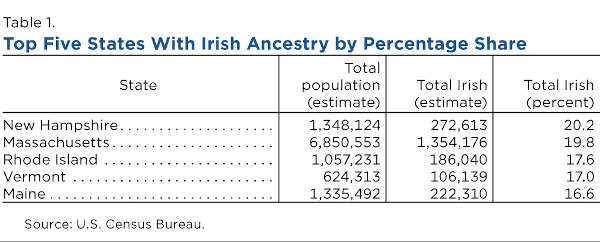
However, the five states with the most smiling Irish eyes are the nation’s most populous: California, New York, Pennsylvania, Florida and Texas. But none of these states have the highest percentage of people with Irish ancestry.
The interactive U.S. map of Irish ancestry will make Irish eyes smile wider when they zoom in to the county level. The map shows counties that are 20% or more Irish (dark green) and ranges down to less than 5% (light green).
Hover your mouse over any county to see its name, the state it’s in and the share of its population that is Irish. In the top left corner, select a state to zoom in to for a better view of counties in that state.
The map shows that Lake County, California, has 6,265 residents – or 9.8 percent – with Irish ancestry.
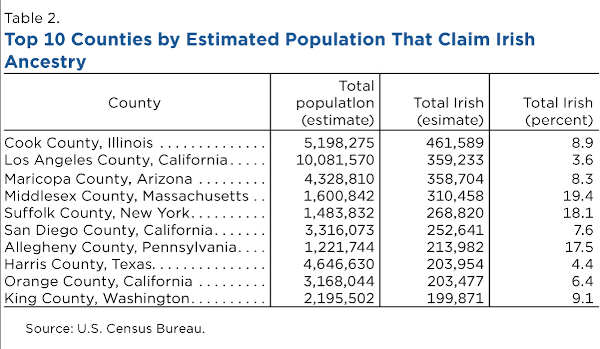
Of the 10 counties with the largest population of Irish ancestry in the United States, Los Angeles County — the nation’s largest — has the smallest (3.6%).
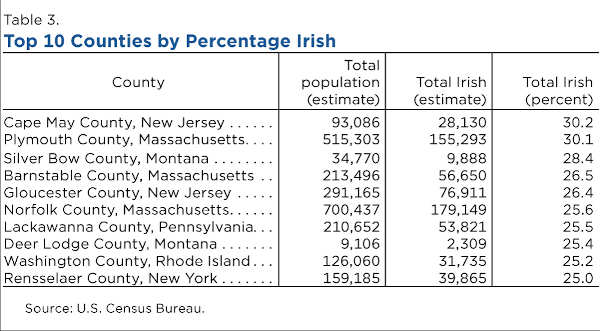
Two counties in Montana are small but very Irish: Silver Bow County at 28.4% and Deer Lodge County at 25.4%.
Derick Moore is a senior communications specialist at the Census Bureau. Gerson Vasquez and Ryan Dolan are data visualization leads at the Census Bureau.
- Details
- Written by: Lake County News reports
“The CHP is committed to making California’s roadways safe for all who use them.” said CHP Commissioner Amanda Ray. “Remember to buckle up, slow down, don’t drive distracted, and never drive impaired. If you chose to celebrate, please do so responsibly by designating a sober driver or making other arrangements to get home safe.”
The CHP wants everyone to remember safe driving rules have not changed and that officers will be on the lookout for impaired driving.
The CHP also cautions drivers that alcohol is not the only substance that can lead to an arrest for driving under the influence. Cannabis, prescription medications and illegal drugs can all lead to impaired driving.
Throughout the country, the National Highway Transportation Safety Administration, or NHTSA, reports that in 2020, 327 fatal alcohol-related crashes occurred on St. Patrick's Day.
Drunk driving accounts for nearly one-third of vehicle-related fatalities in the United States, NHTSA data shows.
In California, the CHP made 67 arrests for driving under the influence of drugs or alcohol on St. Patrick’s Day last year.
Data from the CHP’s Statewide Integrated Traffic Records System shows alcohol- or drug-related crashes resulted in injuries to 31 people.
“Think of your safety and that of others before deciding whether it is safe for you to drive,” Office of Traffic Safety Director Barbara Rooney said. “We urge all drivers to make getting home safely part of your celebratory plans.”
The public can help keep California roadways safe by calling 9-1-1 if they suspect an impaired driver.
Callers should be prepared to give the vehicle’s description, location, license plate number, and direction of travel.
- Details
- Written by: Elizabeth Larson
On Tuesday afternoon, the California Department of Public Health, or CDPH, confirmed Lake County has been moved from the purple or “widespread” tier, the most restrictive, to the red tier, which signifies “substantial” virus in the community.
The changes in tier rankings go into effect on Wednesday, officials said.
CDPH said Lake was among 11 counties to be moved from the purple tier.
The other counties seeing their status changed to red on Tuesday are Monterey, Riverside, Sacramento, San Diego, Santa Barbara, Sutter, Tehama, Tulare and Ventura.
San Mateo moved from the red tier to the orange, or “moderate,” tier, the state said.
The state said no counties moved to a more restrictive tier.
With Tuesday’s tier adjustments, 11 counties are in the purple tier, 42 in red, four in orange and one in the yellow, or “minimal,” tier.
The state said the counties now in the purple tier represent 4.1 million, or 10.3 percent of California’s population, while the red tier accounts for 35.1 million or 87.7 percent, orange covers 817,908 or 2 percent and yellow covers 1,117 people, and doesn’t show up as a percentage of population on the state’s metrics.
Additional tier changes won’t be immediate
The state moved Lake County into the purple tier at the end of November, as Lake County News has reported. Since then, activities like indoor dining have been prohibited.
Last week, state and local officials had announced that they anticipated Lake County would drop into the red tier this week.
As of Tuesday, Lake County Public Health reported that the county had 3,224 confirmed cases – of which 3,148 have recovered – and 43 deaths.
CDPH said Tuesday that Lake County’s new case rate was 5.1 per 100,000, and a seven-day positivity rate of 3 percent.
While Lake’s COVID-19 case rate is down to the lowest rates it has seen since the first half of October, what hastened the tier rating changes was CDPH’s adjustment of tier thresholds due to the state meeting a goal of vaccinating two million people in the communities across the state hardest hit by COVID-19.
Based on the current version of the state’s framework, county officials said Lake County won’t be eligible to move down to the orange tier until at least Tuesday, April 6.
That’s because counties can move only one tier at a time, and Lake County must be in the red tier for three weeks prior to advancing to orange.
To stay in the red tier, the county must have no more than 45 cases per week, and would need to have less than 18 per week to go into orange and four per week to go into the yellow tier, according to Sarah Marikos, Lake County’s epidemiologist.
In related news, the county’s movement into the red tier triggered the Board of Supervisors’ return to “hybrid” board meetings which allow for both Zoom and in-person participation. The board had closed meetings to in-person participation by the public in January after a surge in COVID-19 cases.
County officials said the hybrid board meetings will resume on Tuesday, March 23.
The capacity of the board chambers, as modified to accommodate social distancing, is 23 people. To encourage broad and safe participation, electronic options – phone, Zoom, Facebook, YouTube, written Granicus eComment and Lake County PEG TV – will continue for the foreseeable future, the county reported.
Information on the tier assignments and the changes in restrictions can be found here.
A rundown of Tuesday’s updates is here.
Email Elizabeth Larson at
- Details
- Written by: Elizabeth Larson
The California Employment Development Department said the unemployment rate dropped 0.3 percentage points to 9.0 percent in January as the state’s employers lost 69,900 jobs. The EDD said California’s January 2020 jobless rate was 4.2 percent.
Lake County’s unemployment rate in January was 8.8 percent, down from 9 percent in December. The county’s January 2020 unemployment rate was 6 percent.
On the national level, the federal Bureau of Labor Statistics reported that the nationwide jobless rate for January was 6.3 percent, down from 6.7 percent in December. The January 2020 federal unemployment rate was 3.5 percent.
California payroll jobs totaled 15,868,000 in January 2021, down 69,900 from December 2020 and down 1,752,800 from January of last year. This comes after December’s downward-revised month-over loss of 75,400 jobs, down by 23,200 jobs due, in part, to new 2020 benchmark data and methodology, the EDD reported.
Despite December and January combining for a two-month total of 145,300 jobs lost, California has regained more than 39 percent of the upwards-revised 2,714,800 nonfarm jobs that were lost during the COVID-19 pandemic in March and April, 2020.
Benchmark revisions to state data amount to a new lower peak unemployment rate of 16 percent during the pandemic, reached in April-May – down from the 16.4 percent estimate. But the job loss from February-December was revised up from 1.46 million to 1.72 million, the state said.
In January, Lake County had a civilian labor force of 28,600 people, up from 28,060 in December and down just slightly from the 28,620 reported in January 2020.
Lake County’s unemployed residents totaled 2,530 in January, compared to 2,470 in December and 1,790 the previous year, according to EDD statistics.
Leading Lake County’s job sectors in January was total farm, which was up by 21.2 percent, while total nonfarm was down by 0.1 percent overall.
Subcategories that showed growth included information, 12.5 percent; professional and business services, 3.1 percent; government, 1.5 percent; leisure and hospitality, 1 percent; and service producing, 0.3 percent.
The largest declines were in wholesale trade, -11.1 percent; goods producing, -4.3 percent; and private service producing, -0.3 percent.
In January, Lake County ranked No. 36 out of the state’s 58 counties for its jobless rate.
Lake’s neighboring counties’ jobless rates and ranks in the latest report are Colusa, 15.6 percent, No. 57; Glenn, 7.9 percent, No. 24; Napa, 8.6 percent, No. 31; Sonoma, 7.1 percent, No. 14; and Yolo, 7 percent, No. 13.
The highest unemployment rate, 16.5 percent, was reported in Imperial County, while Marin, at 5.4 percent, had the lowest statewide in January, the EDD reported.
The state employment picture
The EDD report said the number of Californians with jobs in January was 16,988,800, an increase of 31,800 jobs from December’s total of 16,957,000, but down 1,624,500 from the employment total in January of last year.
The number of unemployed Californians was 1,680,100 in January, a decrease of 68,400 over the month, but up by 856,300 in comparison to January of last year, according to the report.
Total nonfarm jobs in California’s 11 major industries totaled 15,868,000 in January, a net loss of 69,900 jobs from December. This followed a downward-revision of 23,200 jobs in December for a month-over loss of 75,400 jobs that month, the state reported.
The EDD said total nonfarm jobs decreased by 1,752,800 – down 9.9 percent – from January 2020 to January 2021 compared to the U.S. annual loss of 9,603,000 jobs, a 6.3 percent decrease.
At the same time, the report said the number of jobs in the agriculture industry increased by 2,000 from December 2020 to 420,200 jobs in January 2021. The agricultural industry has the same number of farm jobs as it did in January 2020.
Six of California’s 11 industry sectors gained jobs in January:
– Trade, transportation, and utilities (+13,700) had the state’s largest month-over increase thanks to gains in retail trade;
– Government and professional and business services each had an increase of 3,600 jobs;
– Financial activities and information each grew by 600 jobs;
– Mining and logging was up by 500 jobs.
On the loss side, leisure and hospitality lost 70,600 jobs due to large losses in accommodation and food services.
Other losses were reported in the following:
– Education and health services, down 10,000 jobs;
– Manufacturing, down 4,600 jobs;
– Construction, down 4,000 jobs;
– Other services decreased by 3,300 jobs.
The EDD also reported on Unemployment Insurance claims.
There were 818,589 people certifying for Unemployment Insurance benefits during the January 2021 sample week. That compares to 1,007,331 people in December and 339,026 people in January 2020.
Concurrently, 58,377 initial claims were processed in the January 2021 sample week, which was a month-over decrease of 100,715 claims from December 2020, but a year-over increase of 12,635 claims from January 2020, the EDD reported.
Email Elizabeth Larson at