 How to resolve AdBlock issue?
News
- Details
- Written by: Lake County Association of Realtors
Over the month of January 2024, a total of 51 single family homes were sold through the multiple listing service, compared to 54 in December and 52 sold a year ago during the month of January 2023. These include traditionally built “stick-built” houses as well as manufactured homes on land.
There were five sales of mobile homes in parks in January, compared to six sold in December and compared to six sold in January last year.
For bare land (lots and acreage) 16 were sold in January, the same as in December, compared to 19 that time the previous year in January 2023.
There are 343 “stick built” and manufactured homes on the market right now. If the rate of sales stays the same at 51 homes sold per month, there are currently 6.7 months of inventory on the market. That means that if no new homes are brought to the market for sale, in 6.7 months, all of these homes would be sold and there would be no homes available for sale.
Less than 6 months of inventory is generally considered to be a “sellers’ market” while more than 6 months of inventory is often called a “buyers’ market.”
January’s inventory was slightly higher than December 2023, when there were 6.4 months of inventory available. Agents are currently reporting an uptick in offers being written.
The total percentage of homes bought for all cash in January:
• 33% (compared to 35% for December and 15% for a year ago in January 2023);
• 27% were financed by Fannie Mae or Freddie Mac (“conventional loans”) compared to 37% for December and 35% for January 2023;
• 25% were financed by FHA (compared to 20% in December and 21% in January 2023);
• 2% were financed by the VA or CalVet (compared to 1% in December and 15% for January 2023);
• 10% had other financing such as private loans, USDA, or seller financed notes (compared to 4% in December, and compared to 6% for January 2023). None of the closed sales in January were reported as assumable loans that were assumed by the buyer.
The homes in January sold at an average of 93.1% of the asking price at the time the property went under contract, but an average of 86.1% when compared to the original asking price when the property first came on the market.
This means that the asking home prices had been reduced from their original list prices before an offer was accepted.
In December, homes sold for 94.6% of the asking price at the time the property went under contract, and 88% of the original asking price.
A year ago in January, homes were selling at 94.2% of the asking price at the time the property went under contract and at 86.9% when compared to the original asking price.
The median time on the market for residential properties in January was 92 days, compared to 62 days in December and 48 days a year ago in January 2023.
The median sale price of a single family home in Lake County in January was $292,000, which is lower than the $305,000 median sale price for December and also lower than the median sale price a year ago of $300,000 during January 2023.
This would indicate that last month, the lower priced homes were selling in greater numbers to bring the median sale price down compared to December 2023 and January 2023.
The median asking price of homes on the market right now is $369,500, compared to December’s $360,000.
In January, 41% of homes sold had seller concessions for an average concession of $11,767; the rate and amount of concessions is higher compared to December 2023’s numbers, when 37% of homes sold had seller concessions with an average concession of $7,679.
In January 2023, 52% of homes sold had an average seller concession of $9,148. This past month in January 2024, the average seller concession was highest for the largest cash transaction, which was a sale for $1,760,000 with a seller concession of $40,000.
FHA loans were next, with an average seller concession of $12,330; conventional loans had an average concession of $10,445. The only VA loan had a seller concession of $7,900.
- Details
- Written by: Chase Sawyer and Joey Marshall
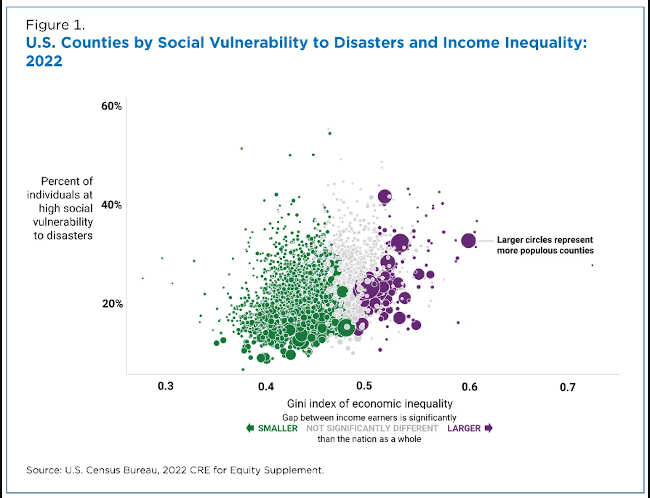
The share of residents socially vulnerable to disasters is higher in counties where income inequality is the same as or greater than the national average, according to a U.S. Census Bureau analysis.
The analysis of the Census Bureau’s Community Resilience Estimates, or CRE, Equity Supplement linked social vulnerability and income inequality.
Nationally, 20.6% of people were found to be highly vulnerable to disasters in 2022. But in counties where income inequality was at or above the national average, 23.4% were highly vulnerable. In counties with income inequality below the national average, 19.2% of residents were deemed highly vulnerable.
Figure 1 shows the relationship between the share of the vulnerable population and the income inequality in each U.S. county. Each circle represents one of the nation’s 3,144 counties, with larger circles representing more populous counties.
Counties with higher levels of income inequality — farther to the right — tended to have a higher share of individuals more socially vulnerable to disasters — closer to the top.
For example, the large purple circle on the far right is a populous county (New York County) with high income inequality (0.5980) and high social vulnerability (33.1%).
Gauging social vulnerability to disasters can help community planners, government entities and stakeholders to prepare for a disaster and plan response and recovery efforts.
The CRE provides an easily understood metric for how socially vulnerable every neighborhood in the United States is to disasters, including wildfires, flooding, hurricanes and pandemics such as COVID-19.
Modeled estimates are based on 10 components of social vulnerability including income, and access to transportation and the internet. Current estimates use Census data and provide the number and percentage of residents in the nation, states, counties and census tracts in three groups, people with zero, one or two, and three or more vulnerabilities.
CRE for equity
This analysis used the 2022 CRE Equity Supplement, also known as the CRE for Equity, which pairs data from the 2022 CRE with stats from the 2018-2022 ACS; 2020 Census; and the Census Bureau’s Planning Database. The findings are the most recent measures of social vulnerability and equity in one source.
There are several new data points in the newest version of the CRE for Equity. Key indicators are available for major race and ethnic groups from the ACS, though it wasn’t used in the analysis in this article.
Users can review area level statistics and explore how these characteristics differ based on race and ethnicity. These data include information on topics such as income, age, unemployment, and health insurance status that play a role in measuring equity.
What the CRE shows
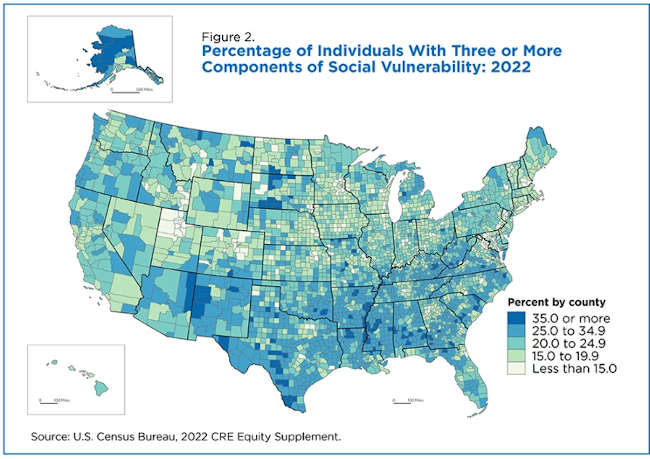
The CRE shows the number and percentage of residents living with zero, one-to-two, or three-plus components of social vulnerability. Those with three or more components are considered to be the most socially vulnerable group and more susceptible to a disaster (Figure 2).
Social vulnerability to disasters is not distributed uniformly. Rather, a swath of counties from the Southwest to the South Atlantic tended to have a greater share of individuals with three or more vulnerabilities.
How income inequality is calculated
The ACS provides a variety of income measures, including the Gini index, a widely used measure of income inequality.
The Gini index measures income inequality ranging from zero to one, reflecting the amount that any two incomes differ, on average, relative to mean income. It is an indicator of how “spread out” incomes are from one another.
Values closer to zero represent a more equitable distribution of income. For instance, if every income earner in a county made exactly $10,000 per year, the Gini index would equal zero. But if one income earner made $10,000 and all other people earned $0, the Gini index would equal one and, therefore, be less equitable.
Income inequality increased in the United States from 2007 until 2022 when it dipped mainly due to income declines among middle and top income earners.
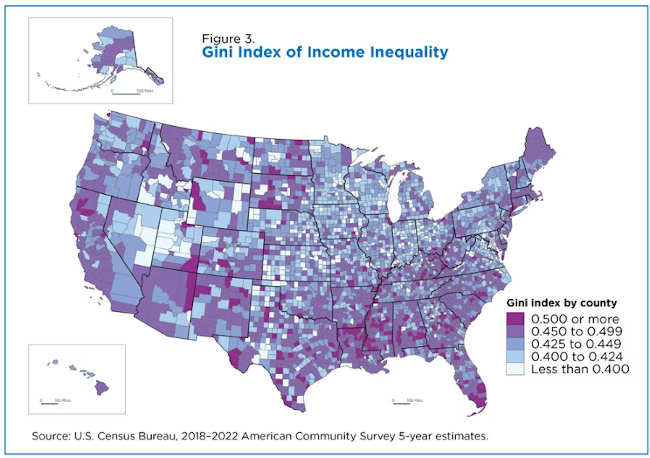
The national average of the Gini index is 0.4829 but income inequality varied widely across the country. Some counties had an estimated Gini index of 0.35 or less (Figure 3). Others had Gini index estimates greater than 0.55, which was higher than most of the world’s countries for which data were available.
Income inequality tends to be concentrated in the Southeast, roughly mirroring the pattern found for social vulnerability to disasters.
For this analysis, we compared the national estimate of inequality to that of each county to determine if there was a statistical difference. We then calculated the number of people with three or more components of social vulnerability in each type of area and found that areas with lower inequality were less socially vulnerable.
These results are consistent with prior research on the impact of income inequality on key well-being measures such as mental health, physical health and longevity.
Chase Sawyer is the technical lead for Modeled Data Product Development, Small Area and Longitudinal Estimates in the Census Bureau’s Social, Economic, and Housing Statistics Division. Joey Marshall is a data scientist in the Census Bureau’s Small Area and Longitudinal Estimates Area.
- Details
- Written by: Dennis M. Gorman, Texas A&M University
Early in the COVID-19 pandemic, researchers flooded journals with studies about the then-novel coronavirus. Many publications streamlined the peer-review process for COVID-19 papers while keeping acceptance rates relatively high. The assumption was that policymakers and the public would be able to identify valid and useful research among a very large volume of rapidly disseminated information.
However, in my review of 74 COVID-19 papers published in 2020 in the top 15 generalist public health journals listed in Google Scholar, I found that many of these studies used poor quality methods. Several other reviews of studies published in medical journals have also shown that much early COVID-19 research used poor research methods.
Some of these papers have been cited many times. For example, the most highly cited public health publication listed on Google Scholar used data from a sample of 1,120 people, primarily well-educated young women, mostly recruited from social media over three days. Findings based on a small, self-selected convenience sample cannot be generalized to a broader population. And since the researchers ran more than 500 analyses of the data, many of the statistically significant results are likely chance occurrences. However, this study has been cited over 11,000 times.
A highly cited paper means a lot of people have mentioned it in their own work. But a high number of citations is not strongly linked to research quality, since researchers and journals can game and manipulate these metrics. High citation of low-quality research increases the chance that poor evidence is being used to inform policies, further eroding public confidence in science.
Methodology matters
I am a public health researcher with a long-standing interest in research quality and integrity. This interest lies in a belief that science has helped solve important social and public health problems. Unlike the anti-science movement spreading misinformation about such successful public health measures as vaccines, I believe rational criticism is fundamental to science.
The quality and integrity of research depends to a considerable extent on its methods. Each type of study design needs to have certain features in order for it to provide valid and useful information.
For example, researchers have known for decades that for studies evaluating the effectiveness of an intervention, a control group is needed to know whether any observed effects can be attributed to the intervention.
Systematic reviews pulling together data from existing studies should describe how the researchers identified which studies to include, assessed their quality, extracted the data and preregistered their protocols. These features are necessary to ensure the review will cover all the available evidence and tell a reader which is worth attending to and which is not.
Certain types of studies, such as one-time surveys of convenience samples that aren’t representative of the target population, collect and analyze data in a way that does not allow researchers to determine whether one variable caused a particular outcome.
All study designs have standards that researchers can consult. But adhering to standards slows research down. Having a control group doubles the amount of data that needs to be collected, and identifying and thoroughly reviewing every study on a topic takes more time than superficially reviewing some. Representative samples are harder to generate than convenience samples, and collecting data at two points in time is more work than collecting them all at the same time.
Studies comparing COVID-19 papers with non-COVID-19 papers published in the same journals found that COVID-19 papers tended to have lower quality methods and were less likely to adhere to reporting standards than non-COVID-19 papers. COVID-19 papers rarely had predetermined hypotheses and plans for how they would report their findings or analyze their data. This meant there were no safeguards against dredging the data to find “statistically significant” results that could be selectively reported.
Such methodological problems were likely overlooked in the considerably shortened peer-review process for COVID-19 papers. One study estimated the average time from submission to acceptance of 686 papers on COVID-19 to be 13 days, compared with 110 days in 539 pre-pandemic papers from the same journals. In my study, I found that two online journals that published a very high volume of methodologically weak COVID-19 papers had a peer-review process of about three weeks.
Publish-or-perish culture
These quality control issues were present before the COVID-19 pandemic. The pandemic simply pushed them into overdrive.
Journals tend to favor positive, “novel” findings: that is, results that show a statistical association between variables and supposedly identify something previously unknown. Since the pandemic was in many ways novel, it provided an opportunity for some researchers to make bold claims about how COVID-19 would spread, what its effects on mental health would be, how it could be prevented and how it might be treated.

Academics have worked in a publish-or-perish incentive system for decades, where the number of papers they publish is part of the metrics used to evaluate employment, promotion and tenure. The flood of mixed-quality COVID-19 information afforded an opportunity to increase their publication counts and boost citation metrics as journals sought and rapidly reviewed COVID-19 papers, which were more likely to be cited than non-COVID papers.
Online publishing has also contributed to the deterioration in research quality. Traditional academic publishing was limited in the quantity of articles it could generate because journals were packaged in a printed, physical document usually produced only once a month. In contrast, some of today’s online mega-journals publish thousands of papers a month. Low-quality studies rejected by reputable journals can still find an outlet happy to publish it for a fee.
Healthy criticism
Criticizing the quality of published research is fraught with risk. It can be misinterpreted as throwing fuel on the raging fire of anti-science. My response is that a critical and rational approach to the production of knowledge is, in fact, fundamental to the very practice of science and to the functioning of an open society capable of solving complex problems such as a worldwide pandemic.
Publishing a large volume of misinformation disguised as science during a pandemic obscures true and useful knowledge. At worst, this can lead to bad public health practice and policy.
Science done properly produces information that allows researchers and policymakers to better understand the world and test ideas about how to improve it. This involves critically examining the quality of a study’s designs, statistical methods, reproducibility and transparency, not the number of times it has been cited or tweeted about.
Science depends on a slow, thoughtful and meticulous approach to data collection, analysis and presentation, especially if it intends to provide information to enact effective public health policies. Likewise, thoughtful and meticulous peer review is unlikely with papers that appear in print only three weeks after they were first submitted for review. Disciplines that reward quantity of research over quality are also less likely to protect scientific integrity during crises.
Public health heavily draws upon disciplines that are experiencing replication crises, such as psychology, biomedical science and biology. It is similar to these disciplines in terms of its incentive structure, study designs and analytic methods, and its inattention to transparent methods and replication. Much public health research on COVID-19 shows that it suffers from similar poor-quality methods.
Reexamining how the discipline rewards its scholars and assesses their scholarship can help it better prepare for the next public health crisis.
Dennis M. Gorman, Professor of Epidemiology and Biostatistics, Texas A&M University
This article is republished from The Conversation under a Creative Commons license. Read the original article.
- Details
- Written by: Lake County News reports
At its January dinner meeting, the Clearlake Oaks-Glenhaven Business Association opened the new year to a full house and a packed agenda with speakers from Totes 4 Teens and the District Attorney’s Office.
Newly elected president Matthew St. Clair began the meeting with a moment of silence for Helen Locke, a long-time officer, valued contributor to the association and the community.
“We will miss Helen and offer our support to her husband, Dennis Locke, chair of the Catfish Derby committee,” St. Clair said.
St. Clair then thanked Sherry Harris and her team for informing members of the work her organization does to make sure foster teens are not forgotten and Susan Krones for her informative talk on the many scams out there and how to avoid getting tricked into handing over personal information — and money.
St. Clair then announced the new officers and officially kicked off the 40th annual Catfish Derby.
The Catfish Derby is a one-of-a-kind event that draws nearly 1,000 anglers and their families and friends to Clearlake Oaks.
“It’s a boost for our economy,” St. Clair said. “Nearby resorts, hotels and campgrounds fill up and shopping at our grocery stores and bait and tackle shops benefit from the influx of visitors who also dine at our restaurants and take in the other sights and all our county has to offer.”
Along with his wife Stacy, St. Clair is a long-standing volunteer of the Catfish Derby committee that is once again chaired by Dennis Locke.
He credited Locke with the success of the derby, noting his committee of volunteers have been working out the details of the three-day event since last November.
Reached by phone for this article, Locke noted that last year the derby drew 958 anglers, their families and friends.
“For a small community like ours — about 2,200 residents — that’s a crowd,” he said. “The outstanding lake conditions brought in the crowds last year and it’s shaping up to be another good year. A full lake bodes well for our milestone 40th anniversary.”
According to Locke there are other catfishing derbies but none that bear the distinction of being the largest of its kind west of the Mississippi — and occurring in an ancient lake considered to be the largest fresh warm water lake in the nation.
“The annual 3-day event is definitely a family affair and, for some, a long-time tradition,” he said.
Locke estimates 80% fish as families with 60% of the registered anglers hail from outside of the County, coming from all over the United States.
Many anglers bring along their family that don’t register to fish but come to cheer on their dads, moms, other family members and friends. Last year, 15 members of the Parish family attended.
“They all came to honor the legacy of Albert Parish Sr., who had recently passed away and was a derby faithful, attending the derby for 18 years. The Parish family came from Oklahoma, Kentucky, Tennessee, Texas and Southern California,” Locke said. “It’s families like these that make the derby unique and a whole lot of fun.”
The business association sponsors the event each year — fronting the money to keep the derby going.
“Last year the derby raised $25,000. The proceeds go right back into the Clearlake Oaks and nearby communities to support academic and sports programs, elder needs, and other nonprofits. The more we raise the more we give back to our communities,” said Dennis Krentz, the association treasurer.
The 2024 Derby will be held at the Clearlake Oaks Fire Station from May 17 to 19.
This year $10,000 in prizes will be awarded in three categories — one for adult entries and two for youngsters.
As is the tradition, there will be lots of raffles and great prizes. Derby T-shirts and hats will be on sale and there is a discount for all who register by May 16.
Advance registration is now open at www.clearlakeoaks.org/derby. Onsite registration starts at noon on Thursday, May 16.
Trophies and cash are given out on the last day of the derby where everyone enjoys the awards ceremony, a fabulous meal and camaraderie.
St. Clair encourages everyone to check out the association website to stay informed of meeting details.
“We meet on the fourth Thursday of the month at the Moose Lodge in the Oaks,” he said. “Everyone is welcome to attend our dinner meetings — visitors and new members alike. We hope you’ll consider joining our dynamic organization.”